View Worldwide Fishing Activity Heatmaps and Vessel Tracking Animations
The Fishing Activity Viewer, developed by the Institute for Big Data Analytics at Dalhousie University, presents generalized heat maps and detailed tracking animations of fishing vessel activity. Using Automatic Identification System (AIS) data collected between 2012 and 2016 by Exact Earth Ltd. 2017, and processed courtesy of MEOPAR, researchers at the Institute for Big Data Analytics applied machine learning techniques to determine fishing activity and distance to shore information for selected vessel types, producing billions of individual points for visualization.
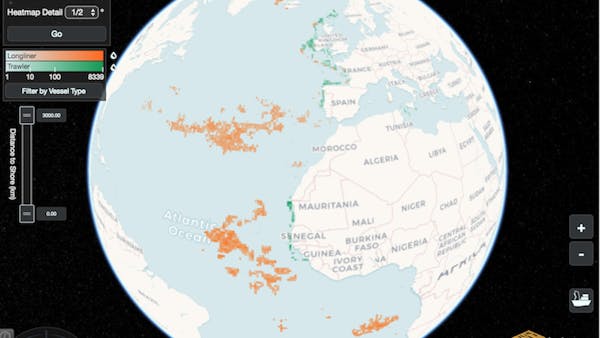
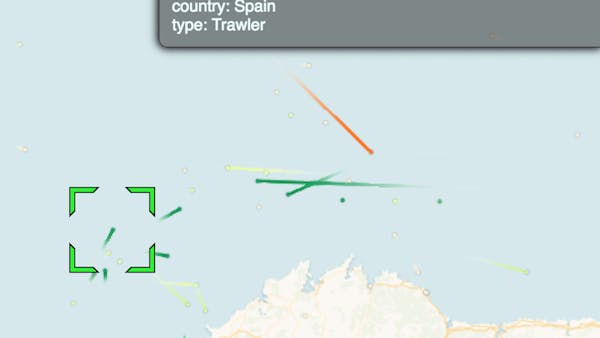
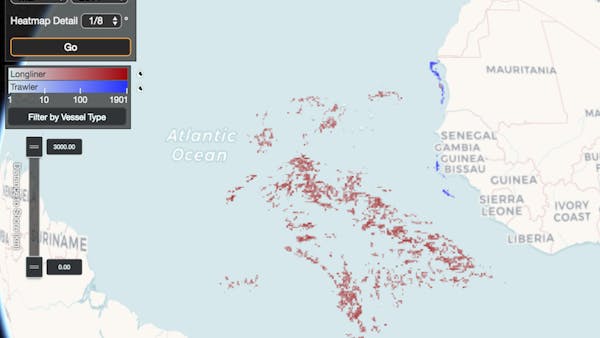
With Cesium, users can view and dynamically filter monthly heat maps of fishing activity by vessel type and distance to shore. Heat maps are generated using the Datashader Python library and displayed as primitive collections in Cesium. When the user zooms in to smaller regions on the globe, the general heat map is replaced with animated vessel tracking data that indicates fishing and non-fishing movements using selectable Cesium entity objects.