Visualize the State of the Planet with Timely Datasets on Resource Watch
World Resources Institute developed Resource Watch with over 30 technology and data partners to catalogue and visualize open geospatial datasets. The platform gathers curated data to explore and discover connections between different environmental and social issues. Users can overlay different datasets, create shareable data visualizations, make custom dashboards, read data insights in the Resource Watch blog, and see near–real time data on the state of the planet.
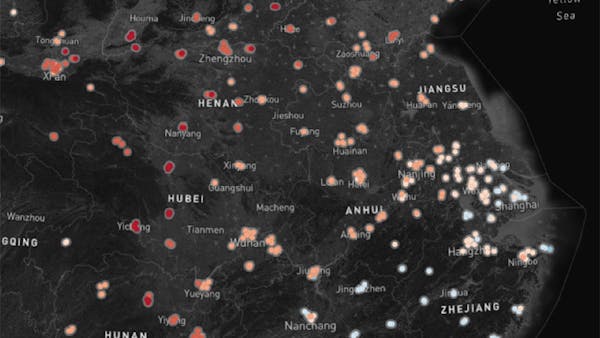
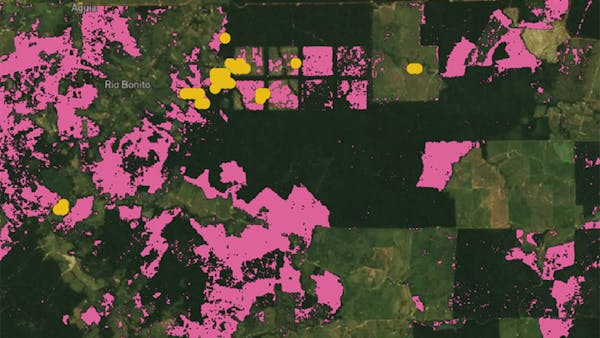
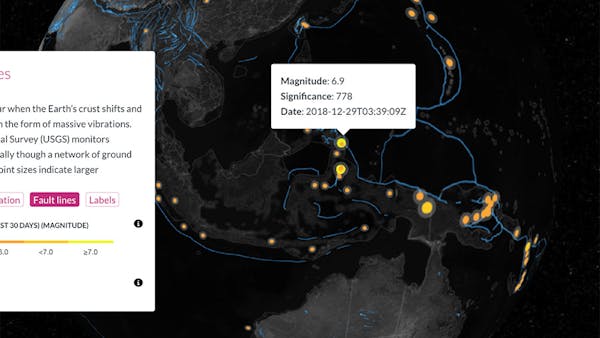
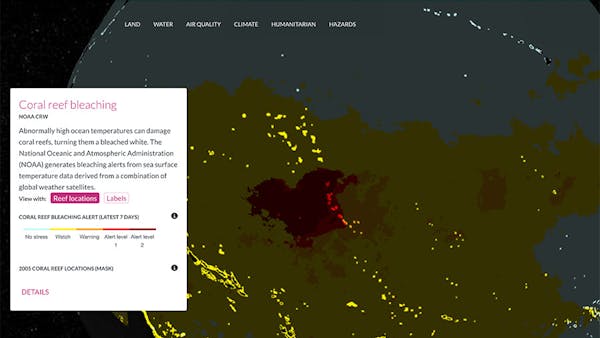
CesiumJS drives Planet Pulse, Resource Watch’s interactive visualization of near–real time data from aerial and ground-based monitoring systems covering local air quality, temperature, precipitation, disasters, land use change, and more. Cesium’s virtual globe engine provides an ideal starting point for an overview of global environmental challenges and hazards and invites users to zoom in to discover detail. The visualization supports map tiles and point queries from several data services. The platform is built on an open source codebase and made available at the project’s GitHub repo.