Cesium Story Depicts Damage in Ukraine
A new Cesium Story created by Professor Hidenori Watanave, of the University of Tokyo, and Professor Taichi Furuhashi, of Aoyama Gakuin University, shows the damage in Ukraine.
Open the story in a new window
The Cesium Story ranges all across Ukraine and the surrounding region. It brings together 3D photogrammetry data and satellite imagery from a number of sources and places them all on a Cesium globe. The base layer of global labeled satellite imagery provides geospatial context for what users are seeing, and they can zoom out to see where the images belong in relation to the country as a whole.
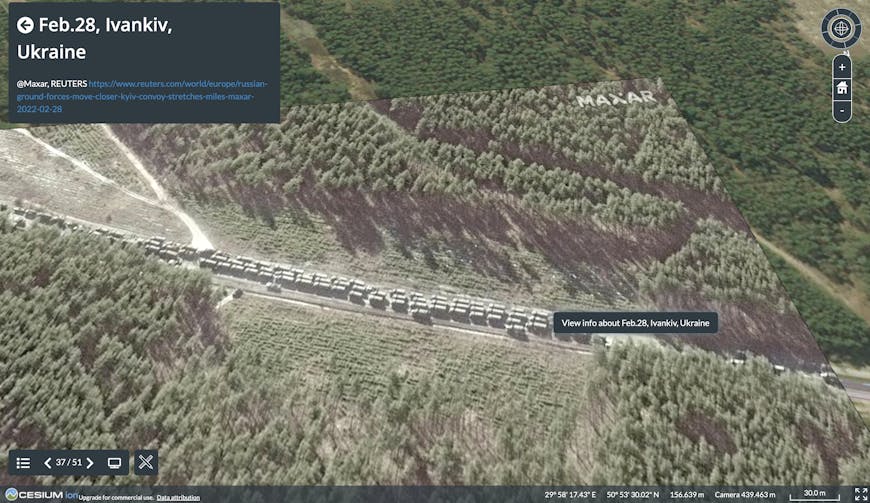
This satellite image, from Maxar, shows a Russian convoy. Throughout the Cesium Story, Hidenori has included dates and further information, including the option to download the KMZ file or other source data. You can also find all of the KMZ files in this GitHub repo.
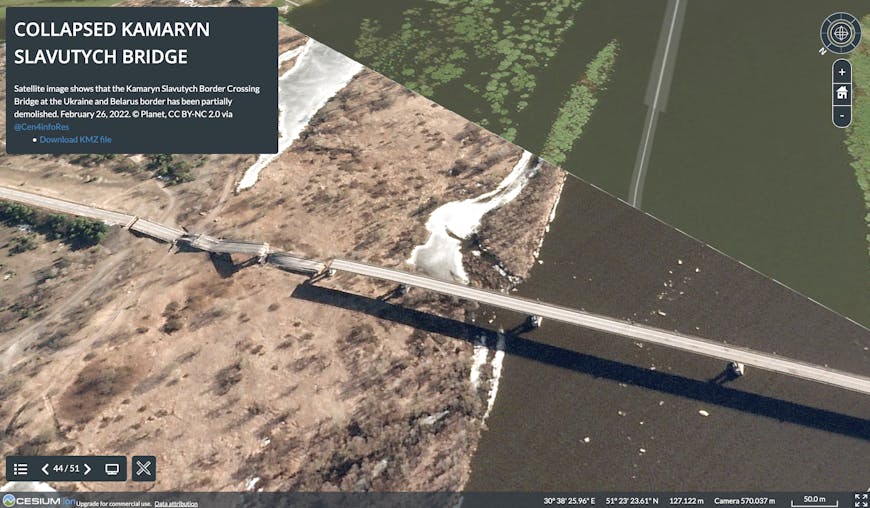
This Planet Labs image shows a collapsed bridge in Ukraine. In the Story, Hidenori alternates images of destruction and of refugees with images of military movements both within and around Ukraine.
Professor Hidenori Watanave is a long-time member of the Cesium community. His projects archive the human impact of major world events, including the bombing of Hiroshima, the devastating earthquake and tsunami at Fukushima, and the attack on Pearl Harbor.
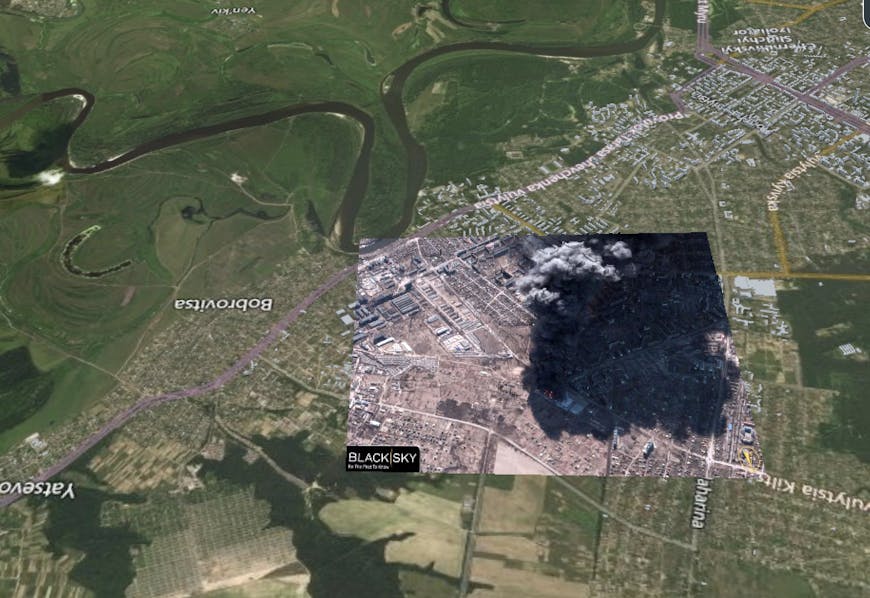
The destruction in the up-to-date satellite imagery, as in this BlackSky image, provides a striking contrast to the base layer, which shows the countryside as it has been.
Cesium Stories provides a simple interface to create and share 3D geospatial presentations without writing any code. In this story, most of the imagery is placed using the ground overlay feature of KMZ.
This photogrammetry model of the destruction is tiled with 3D Tiles.
To create your own Cesium Story, follow our tutorial.