Orbit Logic Collection Planning Software Visualization Generates Collection Plans for Imaging Satellites
Orbit Logic has been using AGI’s Systems Tool Kit for visualization of their mission planning and scheduling solutions since their founding in 2000. When they moved towards web-based and multi-user solutions, they chose Cesium to provide a light-weight, low cost, and web-compatible visualization solution.
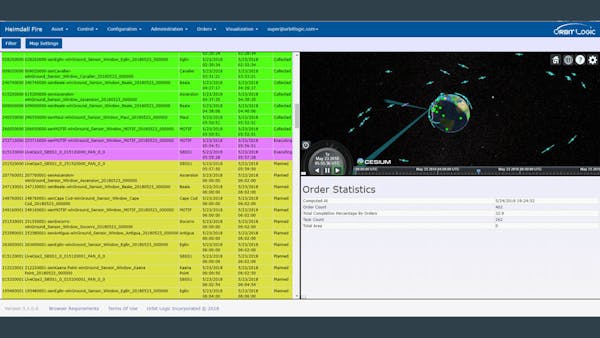
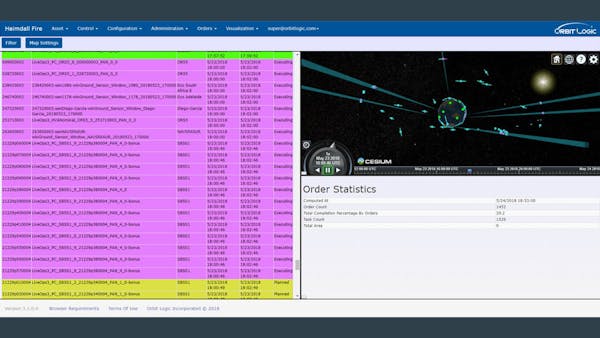
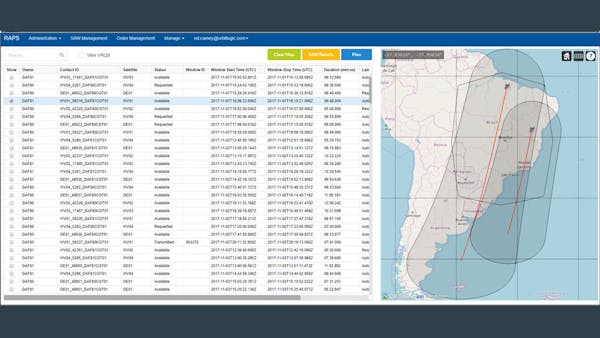
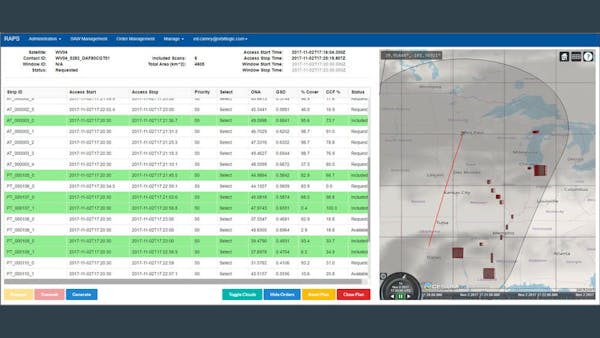
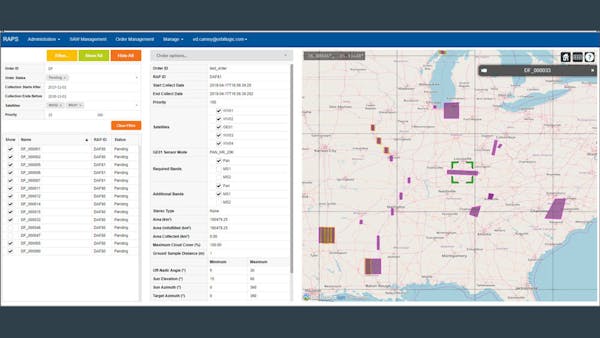
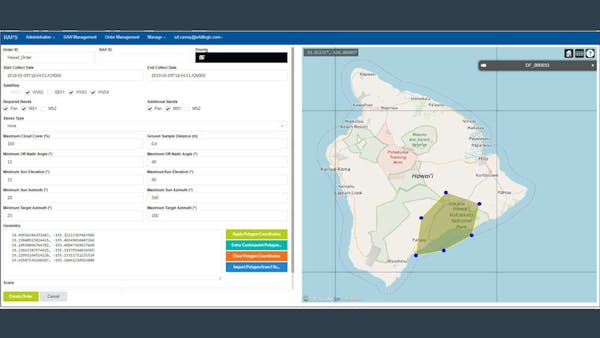
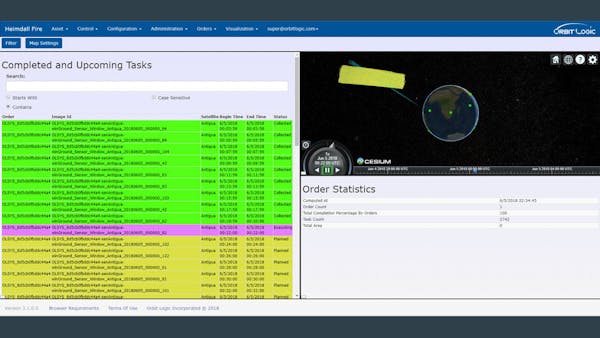
Within their satellite imagery collection planning solutions they use 3D map visualization to show the satellites and their ground track; field of regard and constraints for the sensor; the camera boresight path and off-nadir guidelines; collection orders and labels that are color-coded by status; and terrain and forecasted cloud cover. Within the map, users can zoom in or out, manipulate what is displayed (or not), change colors, adjust the viewpoint, and animate the plan. They employ this Cesium visualization for collection planning from space-to-ground, space-to-space, and ground-to-space. The 3D visualization provides insight that Gantt charts and tables do not fully realize.
Drawing on their experience with STK and Google Earth, they designed their Cesium-based solution to visualize satellites and display various cones (field of regard, field of view, sun glint keepout, antenna blockages, etc.) based on calculations they made themselves. The open source nature of CesiumJS was helpful when they were looking for a way to show umbra/penumbra. They found an example with day/night on one of the Cesium forums. Since they were interested in twilight as well, they extended that example and posted their own solution to make it available for the Cesium community.