Visualizing Switzerland's Geological Resources with Cesium's Subsurface Rendering
Camptocamp has added underground visualization to swisstopo’s digital twin of Switzerland.
A free 3D map of Switzerland for the public
Using 3D Tiles, the Swiss Federal Geoportal 3D Viewer provides free access to an interactive map of the entire country, including terrain, bridges, buildings, and even trees—more than 70 million objects.
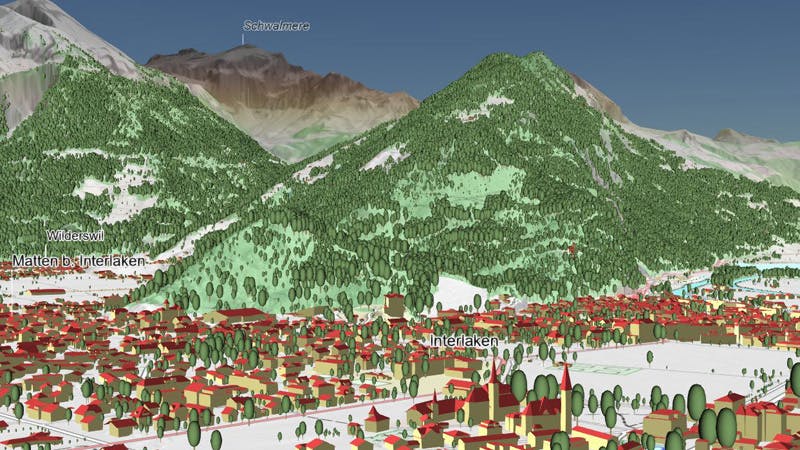
The swisstopo 3D portal is an interactive map of Switzerland, including both the natural and built environment.
While this 3D map is very impressive, it doesn’t provide a complete picture of the country: underground resources such as groundwater, mineral layers, and spaces for basements, parking garages, subways, and other structures were all missing.
Seeing the world below
The Federal Office of Topography swisstopo wanted to show not just what was above ground in Switzerland, but what was below ground as well. So in collaboration with Camptocamp, we added support for underground visualization to the CesiumJS 1.70 release.
Camptocamp has implemented these new capabilities in swissgeol, swisstopo’s 3D viewer for geological data on the web.
swissgeol brings together numerous underground datasets, including boreholes, seismic data, and bedrock maps. This data was previously available separately and in 2D, but by bringing them together, swissgeol provides users a more complete picture of what is underground.
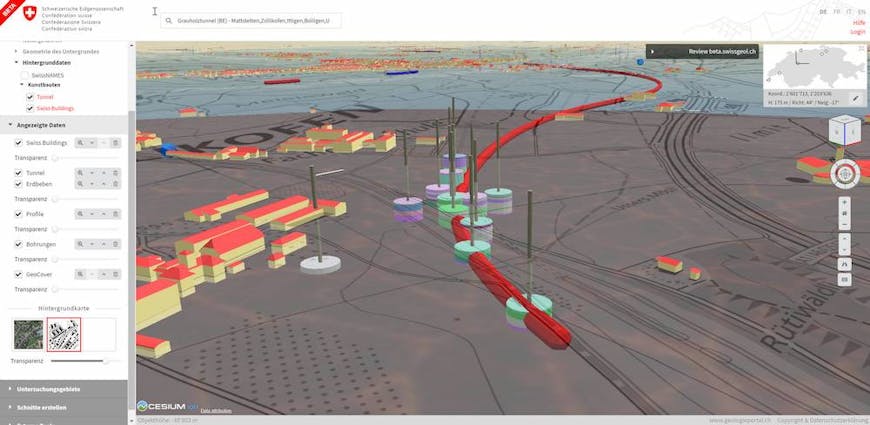
Boreholes shown underground in swissgeol, together with buildings and terrain and imagery data above ground.
All this data streams smoothly to the browser thanks to 3D Tiles created with Cesium ion’s 3D tiling pipelines. Camptocamp prepares the data using FME, geological 3D-modeling packages, and Python.
Users can adjust the transparency of each layer, including surface imagery, and can also view cross-sections.
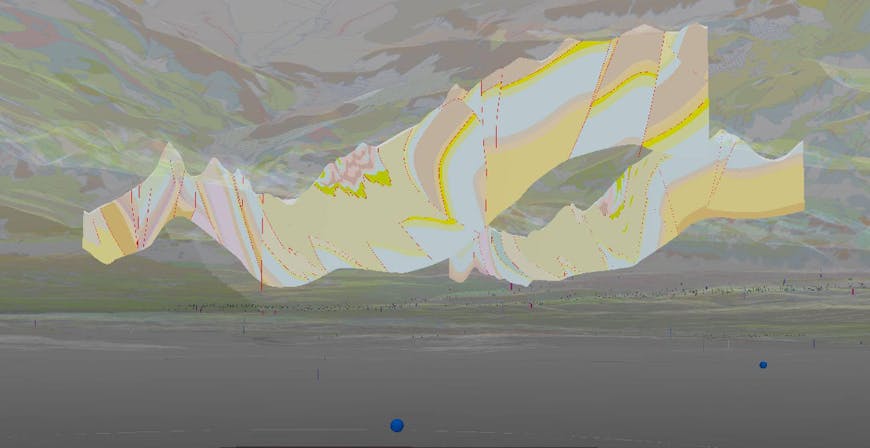
Cross-section data with transparent terrain and ground imagery in swissgeol.
Geological data at work
The viewer is freely available to the public and will serve numerous needs in the geological community. Geological engineers will be able to analyze potential projects, such as transportation tunnels, and perform risk analysis, such as for rock slides. Decision makers will have better base data for education or for choosing appropriate project sites.
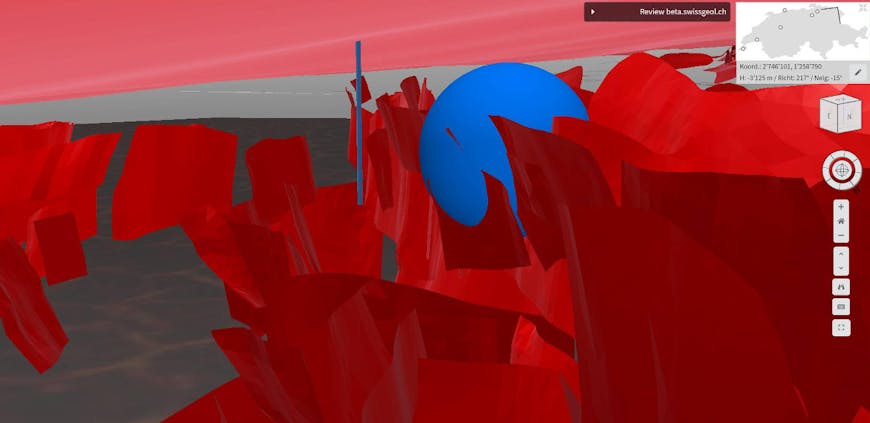
For example, while currently about 75% of Switerland’s energy comes from imported fossil fuels, their new energy policy, Energy Strategy 2050, aims to increase reliance on local shallow geothermal energy.
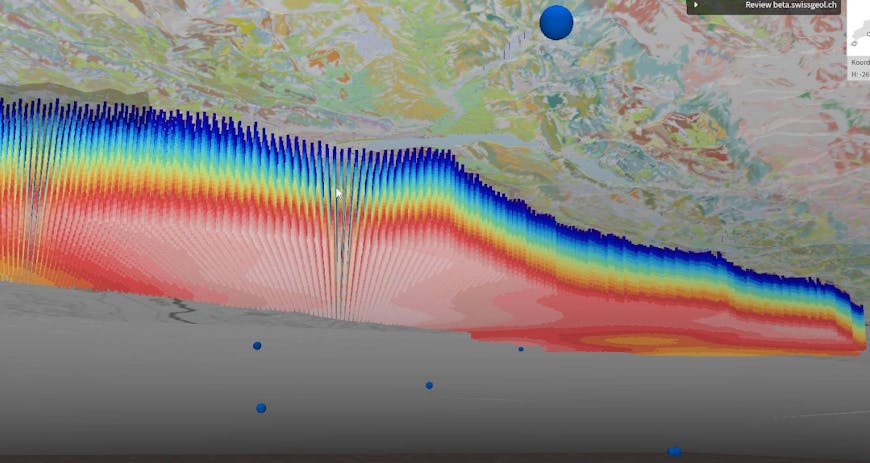
Geothermal datasets visualized in swissgeol.
Until now, creating a geothermal project proposal required collecting all the different datasets, e.g., geological maps, boreholes, cross sections, 3D models, seismic data, etc. Each dataset had to be copied and stored individually or a database connection had to be established using GIS or 3D modeling software. And the datasets could only be visualized in 2D or model-based in 3D. swissgeol dramatically simplifies this process, bringing together all the datasets into a single portal that can be shared instantly.
Visualization of a deep geothermal well together with a complex fault pattern and earthquake location.
Future work
swissgeol is currently in beta. In the future, swisstopo and Camptocamp plan to add a number of capabilities, including adding picking and styling so that relevant attributes of the data can be queried, filtered, analyzed, and downloaded. Registered users, including those at swisstopo, who need additional capabilities will also be able to access further functionality such as upload/download of user-generated data and the ability to create closed user groups for sharing sensitive data with a limited number of users.
If you have underground data, you can visualize it alongside all your other 2D and 3D data by uploading it to Cesium ion.