Cesium Tools for Better Construction Management
Cesium technology is revolutionizing the construction industry. The Smart Construction dashboard, which we developed in partnership with Komatsu, makes it possible to visualize, measure, and analyze the progress of a construction jobsite more quickly than ever before. Here’s how it works.
Combining diverse datasets to evaluate progress
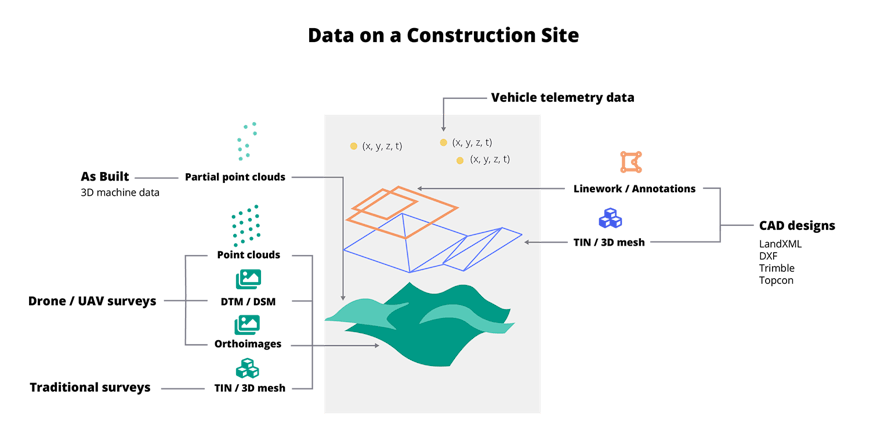
To stay on track, site managers must constantly compare the plan, typically provided in a CAD design, against what’s actually happening on the site, captured by traditional surveys, drone surveys, and data from smart construction vehicles, including as-built data and vehicle telemetry data.
The app combines design models with real world, time tagged data to make measurements and track progress. Cesium takes these many data sources as input, fuses them together to create up-to-date 3D representations of the jobsite, and processes them into 3D Tiles so they can be shared and streamed easily.
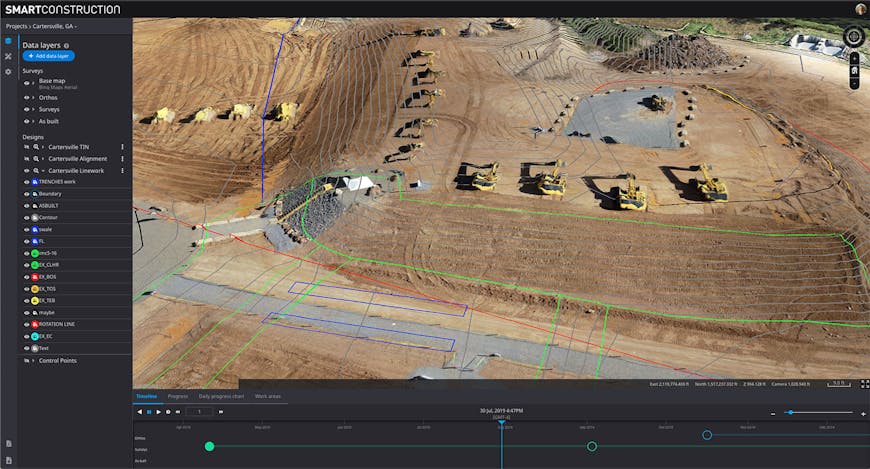
A DSM and orthoimage, converted into 3D Tiles, overlaid with vector data from a linework file created using a CAD package
Collecting the data
Building the Smart Construction app required us to prepare to ingest a variety of data types, collected in different ways and in different degrees of completeness.
Traditional survey
The traditional way to survey sites uses a rover to make GPS measurements at a grid of locations across the job site. Collecting data this way will take a day or more to see results, and data is collected sparingly. This data can be compiled into a 3D mesh in LandXML, DXF, or other triangle mesh formats.
Drone survey
Surveys can also be performed by drone or UAV. About once a week up to once a day, a drone flies over the site and takes pictures at several locations across the job site. Photogrammetry software the transforms these photos into a holistic 3D model of the terrain. Common outputs include point clouds, DTM/DSM terrain data, and orthoimages.
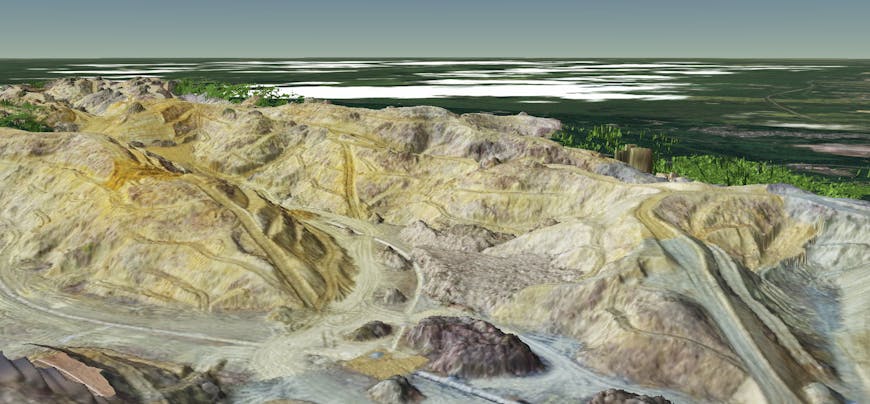
Point cloud of a jobsite in Osaka, Japan, collected by drone, converted into a mesh, and tiled into 3D Tiles by Cesium ion.
Drone surveys are much quicker than traditional surveys. For one company in the UK, moving to a drone-based data collection method—together with Cesium’s 3D Tiling capabilities—reduced the time from collection to visualization from 3 days to 30 minutes. And there was less than a 2% difference in the measurement results from each method.
Smart vehicles
One of the latest trends in the construction industry is machine tracking, either with GPS sensors embedded in construction equipment or with after-market sensors attached to equipment. These sensors track the work each machine completes as it moves around the jobsite, providing “as built” data—partial terrain data that, when merged with the existing surface, can give a near real time picture of the site’s terrain, usually hour by hour.
3D Tiles makes it possible to stream this data as it is received, and users can move forward and back in time to see the change in a jobsite over time.
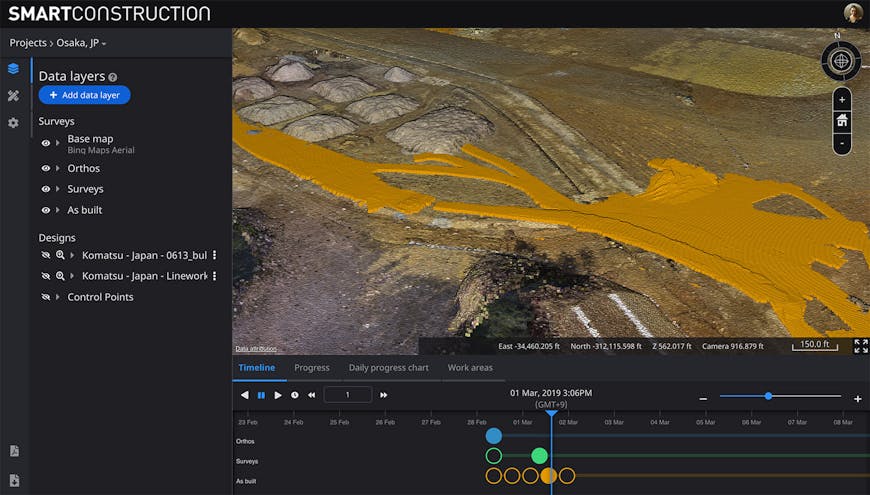
In yellow, recent “as built” data collected from construction machinery fitted with sensors, fused with a previous drone survey of the entire jobsite site. Cesium lets you combine and visualize different surfaces across any time.
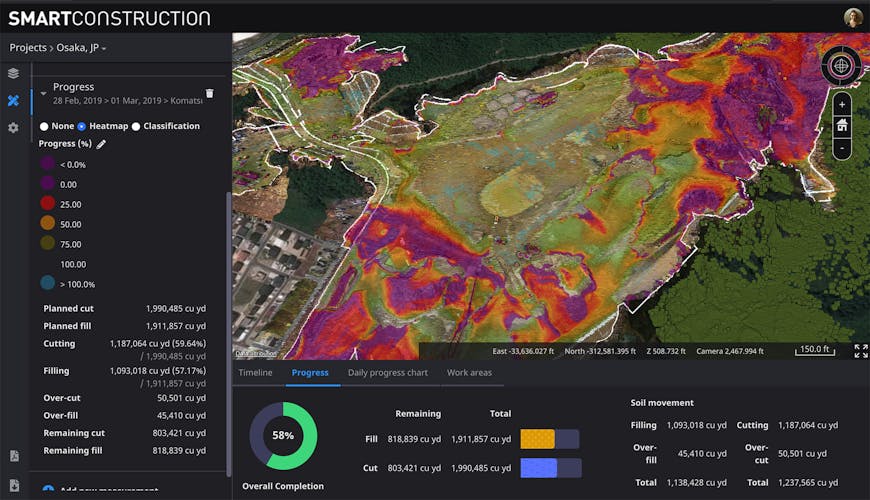
A cut and fill analysis highlighted with a heatmap, showing just how much dirt needs to be moved and how much dirt has already been moved.
For instance, if project managers need to send results to a client for billing purposes, in Cesium they can understand the overall percentage of dirt that has been moved, and the areas that still need work. Determining the amount of material remaining in a stockpile is as simple as clicking to create a measurement: the app calculates the volume, weight, and value of the material.
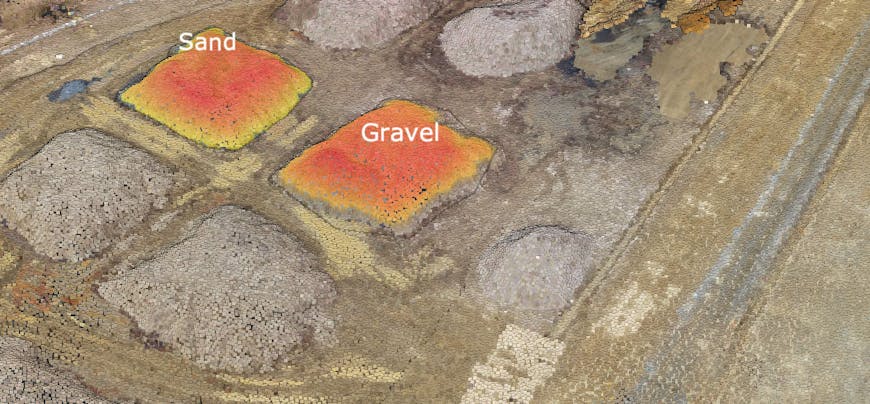
Measuring stockpiles.
Project managers can also review a route before it’s traveled by clicking out a path and checking the slope, either as a heatmap or a profile view using the 2D cross-section tool.
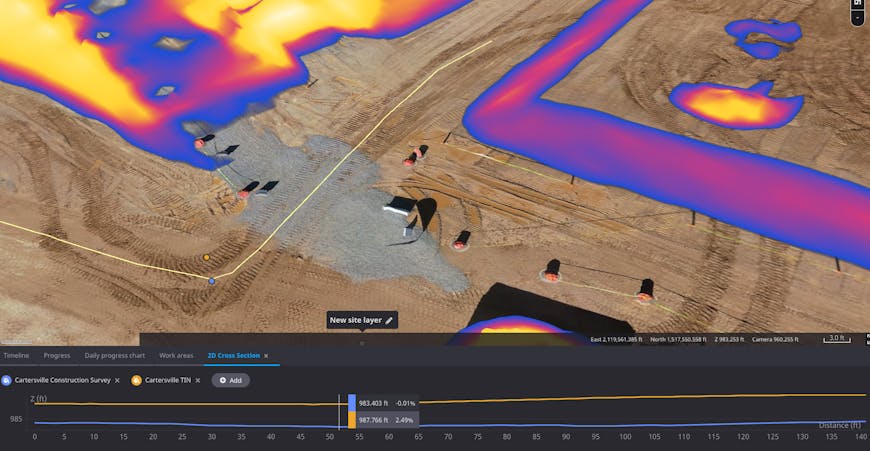
Heatmap of terrain slope.
This is just an overview of the many capabilities Cesium powers in the Smart Construction app. Head over to our construction industry page to watch videos and learn more.