Inspect Features in Your 3D Tilesets with Cesium Stories
We created 3D Tiles to stream, visualize, and analyze massive 3D content like entire cities or complex architectural models. With today’s update to Cesium Stories, you can now click to inspect feature data in your 3D Tiles.
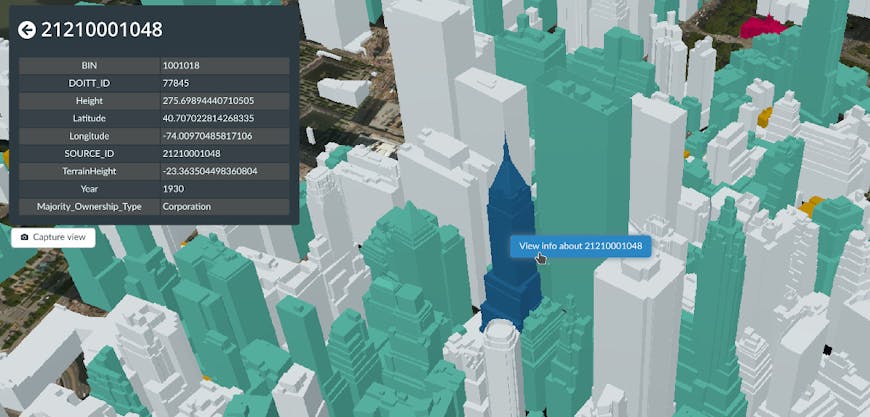
You can now click on any 3D Tiles feature in Cesium Stories, like buildings in the New York City tileset, to inspect its data.
Let’s say you wanted to understand the distribution of medical facilities across New York City. You could highlight all these buildings in your 3D Tileset using styling, and then click to see each facility’s capacity, whether it has urgent care, and their website/phone number(s).
You can also share your Cesium Story to allow other users to inspect it in the same way, whether they’re doing a thorough analysis in the office or while they’re out in the field. On mobile devices the infobox can be collapsed or expanded to easily switch between a full view of the 3D scene and the feature data.
Cesium Stories works on any modern web browser. On mobile devices the infobox can be collapsed or expanded to easily switch between a full view of the 3D scene and the feature data.
Feature picking in Cesium Stories works on any 3D Tileset that has feature data with no limit on the physical size of a feature, so this is well-suited for industries like BIM/CAD where you need to inspect very large pipes down to the smallest valves or screws.
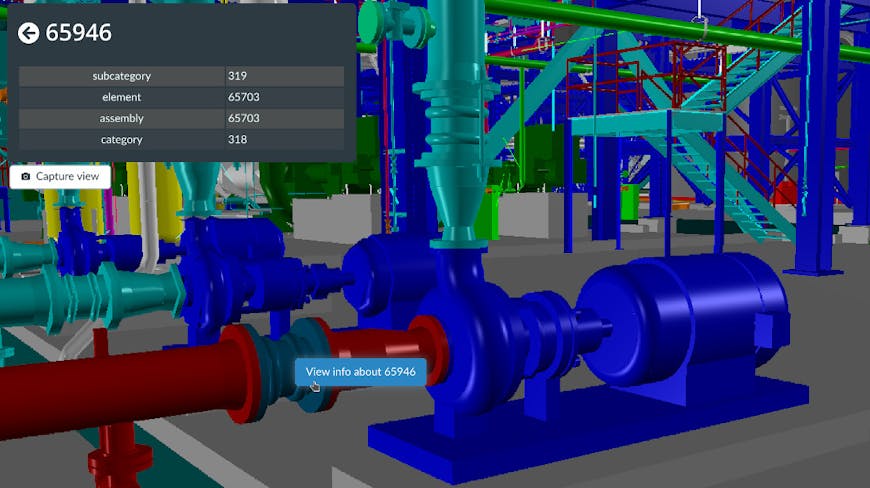
Feature picking in Cesium Stories works on any 3D Tileset that contains feature data, like pipes and valves in this power plant BIM model.
Feature picking works on vector data as well, like GeoJSON, KML, and CZML. A vector layer gives you an easy way to add or update feature data even if the 3D Tileset itself doesn’t contain any defined features.
In the example below, we took the Vricon photogrammetry tileset of Washington DC from the Cesium ion Asset Depot, which doesn’t have feature data, and combined it with a CZML of building energy use from DC’s open data portal.
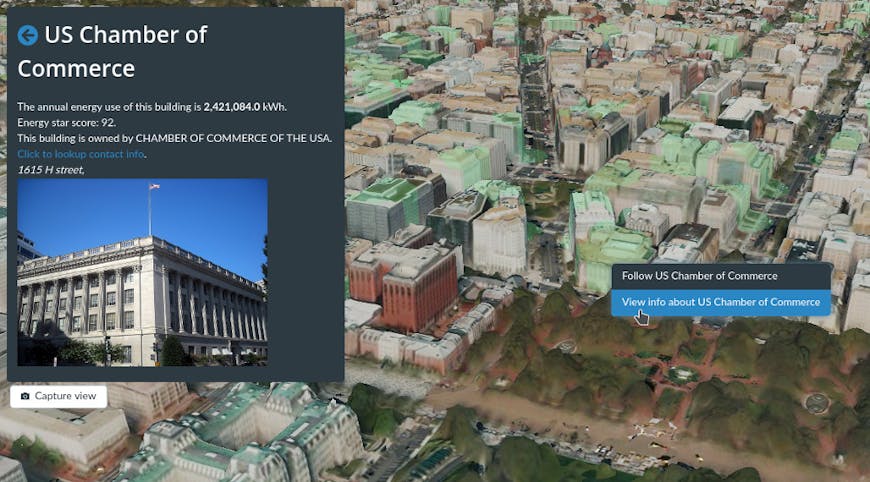
Combining a CZML of energy use with photogrammetry of Washington DC allows us to click on any building to see its energy score. This CZML was customized to add a picture of the building when available.
This allows you to click on any building to see its name, annual energy consumption, and Energy Star score. KML and CZML support HTML descriptions, so you can add images, links, or generally customize how it looks.
We’re excited to see what you build. Learn how to use picking and styling in the Cesium Stories styling tutoral.