Cesium Stories Adds Support for 3D Tiles Styling
We recently launched Cesium Stories - a new app that lets you build and share 3D geospatial presentations on the web without writing any code. To make it even easier to create insightful 3D visualizations, we’re launching a styling editor that allows you to define how features in your 3D Tiles are colored based on their metadata.
Explore a demo of what you can do with this new styling editor in Cesium Stories.
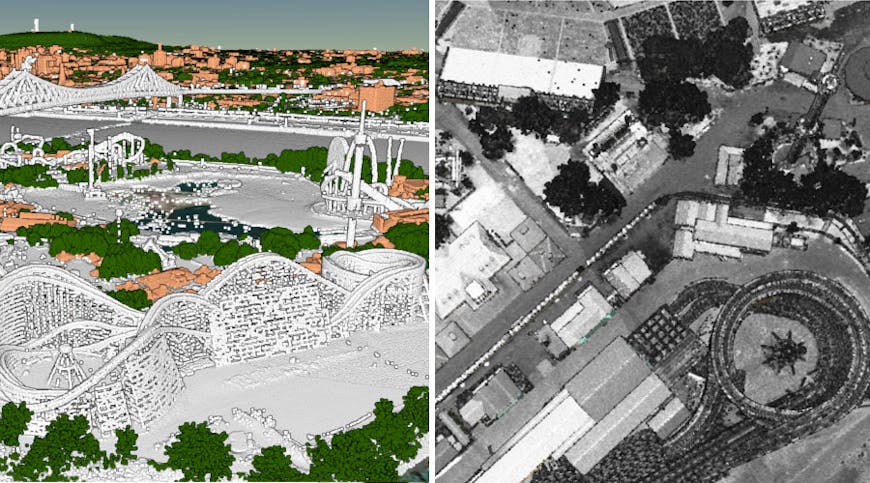
On the left, a point cloud of Montreal is colored based on the classification of each point. On the right, the same scene is colored based on LiDAR intensity. Styling in Cesium Stories allows you to easily define coloring like this based on your metadata.
Styling works with categorical data, like per-point classification, as well as continuous data like LiDAR intensity. You can customize your style’s colors and legend, and re-use it across different tilesets or stories. This can be a great way to easily inspect the accuracy of your point cloud’s classification on any new datasets you upload to Cesium ion.
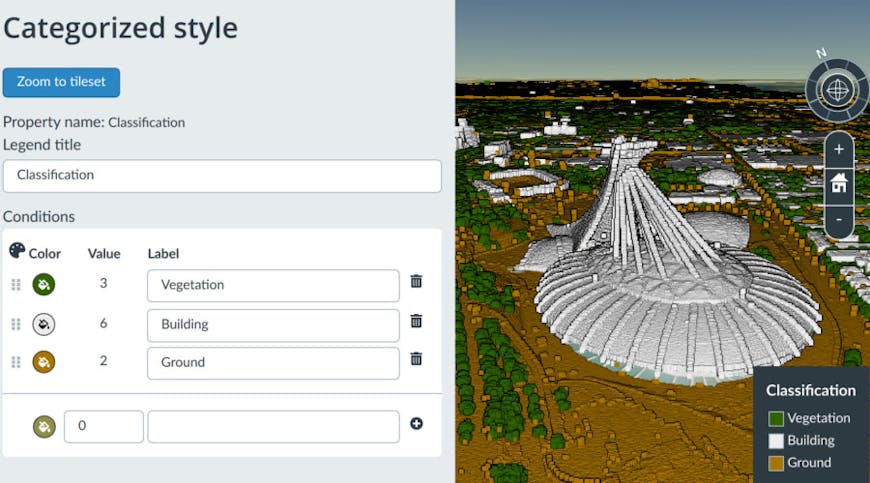
The styling editor allows you to customize the colors and legend labels, and re-use your styles across tilesets or different stories.
You can style any 3D data you upload to Cesium ion that contains per-feature metadata. Below is an example of styling over 1 million CityGML buildings in New York City that were tiled into 3D Tiles on Cesium ion. The buildings are styled based on their year of construction. The oldest buildings have been assigned a distinct color to easily distinguish them.
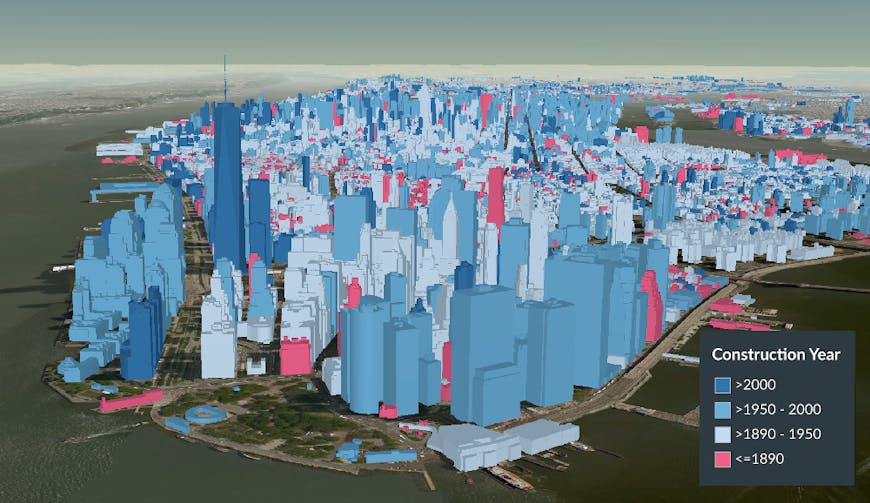
Styling over 1 million New York City buildings based on their year of construction. The oldest buildings are assigned a unique color to easily distinguish them.
Learn how to use the styling editor to style your own 3D data in Cesium Stories.