Learn about Eruptions, Earthquakes & Emissions with this Animated Smithsonian App
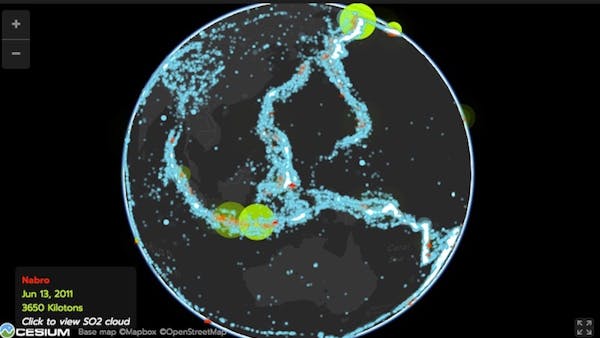
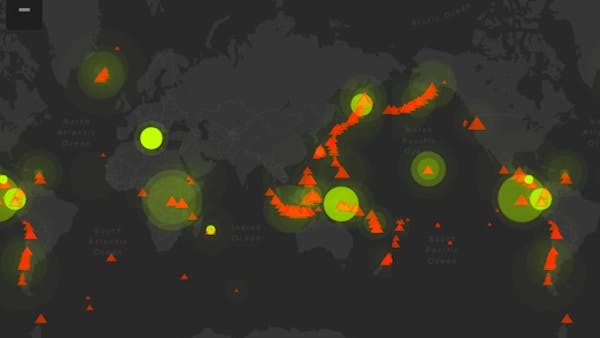
The Smithsonian Institution’s Eruptions, Earthquakes & Emissions (E3) app is a time-lapse animation of volcanic eruptions, earthquakes, and sulfur dioxide emissions from volcanoes for the last fifty years.
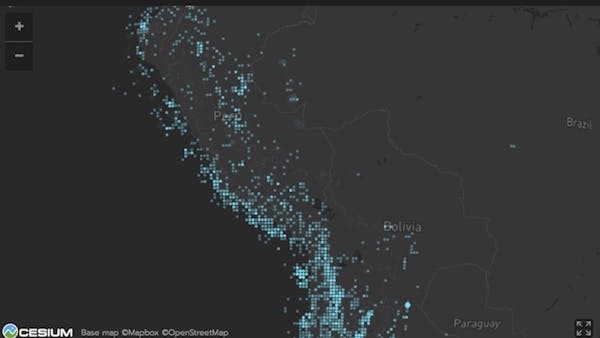
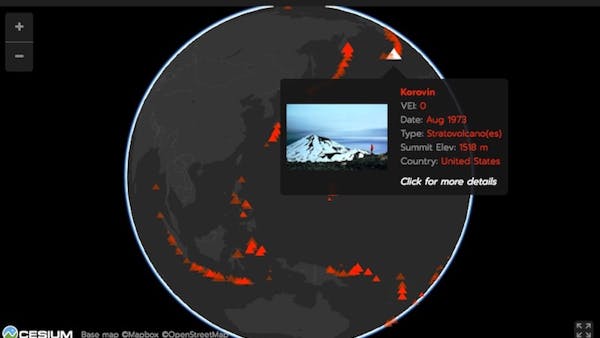
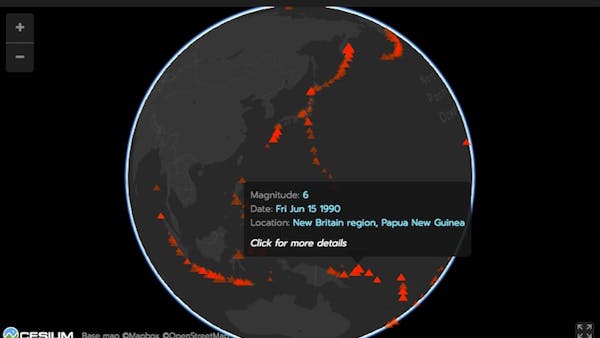
A precursor to E3 was on display in the Smithsonian’s Geology, Gems, and Minerals Hall. In an effort to make the application more widely available, Axis Maps developed E3 using Cesium for both 2D and 3D views. With Cesium, they were able to efficiently render and animate millions of data points in an interactive map. Each point is interactive: users can learn more about the event or visit external pages with even more information.
The app combines eruption data come from the Volcanoes of the World (VOTW) database maintained by the Smithsonian’s Global Volcanism Program (GVP); earthquake data from the United States Geological Survey (USGS) Earthquake Catalog; and SO2 emissions data from NASA’s Multi-Satellite Volcanic Sulfur Dioxide L4 Long-Term Global Database. The earthquake and eruptions data go back to 1960; the SO2 data go back to 1978, when such information began to be monitored. The app remains current by checking for updates weekly.
It uses BillboardCollections for the volcano animations, PointPrimitiveCollections for the earthquake animations, and PrimitiveCollections for the SO2 cloud animations.
The map is still on display in the Smithonian’s Museum of Natural History and is available anywhere through a web portal. E3 was a finalist for a Webby Award. It was also featured in the Smithsonian Magazine and by the BBC.