Entity API Performance
This is a guest post by Yonatan Kra about an optimization the team at webiks implemented for their use case. Their approach reduces jitter for cases where there are very many billboards and labels. It’s a complementary approach to the opt-in explicit rendering mode introduced in Cesium 1.42, and the two methods are compatible. -Sarah
Rendering many billboards and labels
We’ve been using Cesium for the past four years and in every project, we stretch performance a bit farther.
In one of our latest projects, we thought we optimized enough, and then a demand came asking us to multiply the amount of certain dynamic elements. Cesium optimized the handling of points. However, rendering of dozens of thousands of labels and billboards consumes quite a bit of resources. If converting the data to 3D Tiles isn’t an option for you, you can also optimize within Cesium itself.
The first thing we need to do is to see how much of a challenge this issue really is. In order to do that, we will use Chrome performance tool.
For this example, we’ll use some very simple code. It’s going to place lots of cute cats (billboards) with hoops (ellipses) on the map in Washington area, and add a label of the cat’s number (labels):
function randomCoordinateJitter(degree, margin) {
   return degree + margin * (Math.random() - 0.5) / 0.5;
}

var viewer = new Cesium.Viewer('cesiumContainer');
var nCats = 15000;
for (var i = 0; i <= nCats; i++) {
   var entity = viewer.entities.add({
       position : Cesium.Cartesian3.fromDegrees(
           randomCoordinateJitter(-77.009003, .5),
           randomCoordinateJitter(38.889931, .5)
       ),
       label : {
           text : 'CUTE #' + i
       },
       billboard : {
           height : 24,
           width : 36,
           image : 'https://encrypted-tbn0.gstatic.com/images?q=tbn:ANd9GcRhFpaxDXCS5O9hx90F3ufJI2VnC_wW0lPnrr6BIb18P4V5JXxBCg'
       },
       ellipse : {
           semiMajorAxis : 100,
           semiMinorAxis : 80
       }
   });
}
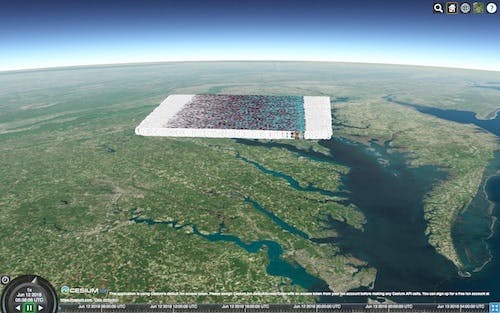
Running this code might cause slow machines to become non-responsive so play with the for loop iterations (thenCatsvalue above) to make it work on your computer. Open Chrome dev tools, go the the performance tab, and start recording. Results might vary according to your machine’s spec, background processes etc., but you should see a jitter. Let’s have a look at the results summary:
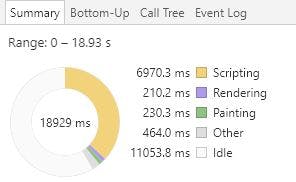
Figure 1. Recording summary of our code running (just showing the page).
We see that the recording ran for almost 19 seconds, and that scripting was more than 1/3 of the time. This is not so good. Let’s have another take at this after the rendering cycle runs for a while:
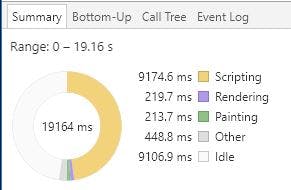
Figure 2. Another recording summary in order to show result is consistent.
Now it’s even worse: 19 seconds recording, with more than 9 seconds scripting. Let’s see what happens behind the scenes:
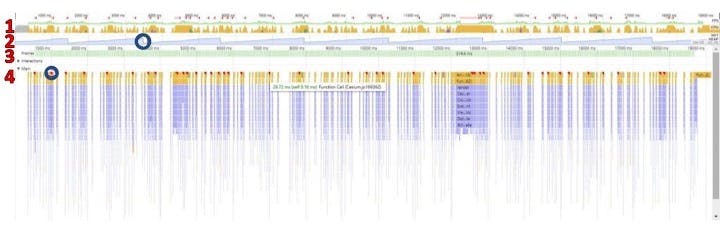
Figure 3. Performance tool’s chart view.
Here’s a breakdown of the parts (numbered in red) in Figure 3:
- Part 1: the general timeline (breakdown of the summary in Figure 4 over time). You can see a timeline of what occupied the thread. All the yellow parts are scripting.
- Part 2: memory consumption over time. This chainsaw pattern is happening because of the rendering cycle: stuff is created during the rendering cycle, then discarded after a while. Note the black circle for the “discard” part (a.k.a., garbage collection).
- Part 3: frame blocks. It’s a little hard to see here, but some are very long.
- Part 4: flame chart, deep diving into the blocks in Part 1. Here you can see a chart of the actual methods that have been used in the yellow scripting parts. See the yellow parts with red (as in the blue circle)? These are scripting parts that take too long and thus cause jitter.
If it’s your first time taking a performance recording, I suggest you check out Google’s Tools for Web Developers.
Now we’ll use Figure 3, Part 4 to deep dive into what’s causing the jitter. Let’s click on one of red spots in the flame chart:
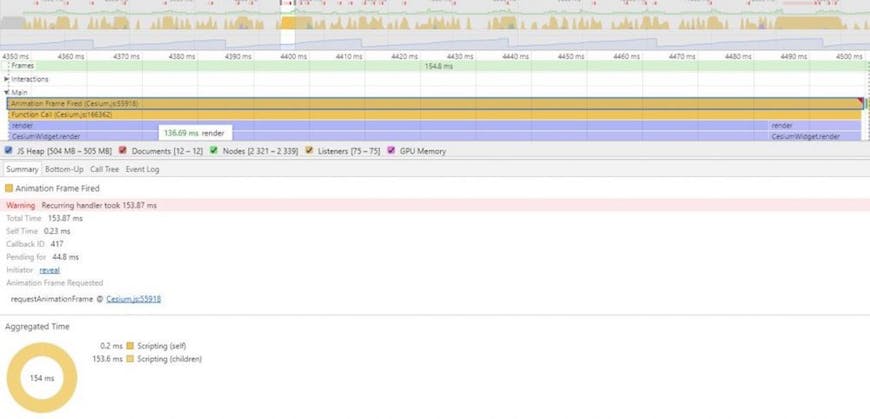
Figure 4. Deep diving into a single scripting block Figure 3, Part 4.
Once I click on the script tile, the summary part changes to show more specific info for this part. Now we can use the bottom up or call tree tabs to find the functions that cause us the most pain:
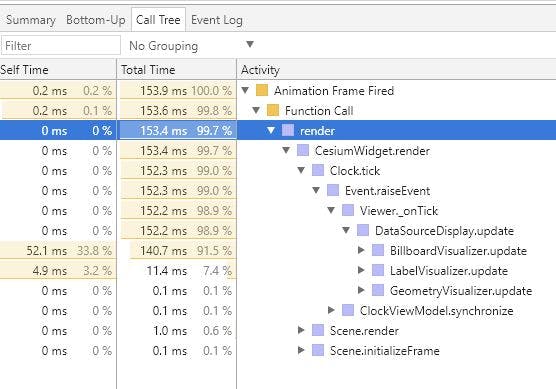
Figure 5. Deep dive into the call tree of the scripting block in Figure 4.
Clicking the “call tree,” I started opening the functions one by one. Animation Frame Fired caused a Function Call, which called “render,” which called CesiumWidget.render and so on. You can see that eventually, at the bottom, BillboardVisualizer.update was causing most of the delay. This is definitely something we can improve.
Now let’s see what the big picture tells us. Let’s have a look at the call tree of the whole recording (just click outside a tile in Figure 3, Part 4):
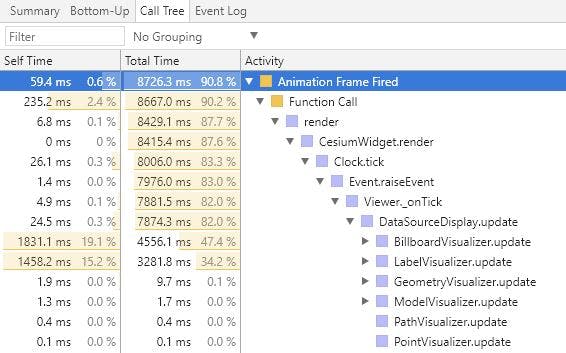
Figure 6. Same deep dive as in Figure 5, but for the whole recording.
Now we see that BillboardVisualizer is not alone—the LabelVisualizer is also taking around 1/3 of our scripting time. If we could find a way to deal with these two, our 15000 entities app would run better.The BillboardVisualizer.update method runs a loop on all the billboards in our entity collection. We would need to find a way to make this loop more efficient.
Actually, Cesium combines graphics in the same data source to one visualizer array, so we actually have three such arrays in our app: billboards, labels, and geometry (for the ellipses). We see that the GeometryVisualizer is very efficient.
Go ahead and take a look at the code.
Solution
As mentioned above, labels and billboards in Cesium have a bit more overhead than the rest of the graphics arsenal. We saw how scripting takes too much of our thread to show a few thousand billboards and labels. The issue might arise from looping over a few thousand billboard and label graphics.
Now I will show a proof of concept for a solution. We will start small and enhance it. Ready? Here it goes.
The problem with the loop is that it can be wasteful in our specific case because we dynamically update only a small part of the entities (our update rate is 600 updates/second out of tens of thousands of entities). It runs over the billboards and labels—even those that were not updated. So what if we could tell Cesium to skip billboards and labels that we didn’t update?
Let’s see one way to do it. In our app’s code, we will add something to the entity:
function randomCoordinateJitter(degree, margin) {
   return degree + margin  (Math.random() - 0.5) / 0.5;
}

var viewer = new Cesium.Viewer('cesiumContainer');
for (var i = 0; i <= 15000; i++) {
   var entity = viewer.entities.add({
       position : Cesium.Cartesian3.fromDegrees(
           randomCoordinateJitter(-77.009003, .5),
           randomCoordinateJitter(38.889931, .5)
       ),
       label : {
           text : 'CUTE #' + i
       },
       billboard : {
           height : 24,
           width : 36,
           image : 'https://encrypted-tbn0.gstatic.com/images?q=tbn:ANd9GcRhFpaxDXCS5O9hx90F3ufJI2VnC_wW0lPnrr6BIb18P4V5JXxBCg'
       },
       ellipse : {
           semiMajorAxis : 100,
           semiMinorAxis : 80
       }
   });
   entity.manualUpdate = true;
   entity.forceUpdate = true;
}
Note the lines:
entity.manualUpdate = true;
entity.forceUpdate = true;
I’ve told Cesium that my entities are now manually updated, and I’ve told Cesium to force the first update.
So far so good, but how can Cesium know about this parameter? We’ll need to get into Cesium’s code.
Fork cesium, clone to your local machine and create a new branch. You can call it “optimized labels and billboards.” Open the Entity.js, BillboardVisualizer.js, and LabelVisualizer.js files to edit.
In Entity.js, we would like to define the properties. Take a look at the code.
Look at the commit in order to see the differences. This is a Cesium convention of adding properties. Note the tests I’ve added are definitely not complete as this is just a POC.
The main take home message here is this—when we change the entity’s forceUpdate property, we also change the label and billboard forceUpdate property. This means we need to define the label and billboard graphics properties.
Next we would like our visualizers to use this new forceUpdate property in the visualizer update loop. Ready? Let’s go!
In LabelVisualizer.js, I’ve added some code to the update method, just below the init of labelGraphics inside the loop:
if (entity.manualUpdate && !labelGraphics.forceUpdate) {
   continue;
}
labelGraphics.forceUpdate = false;
How did I know that I needed to update the update method? Look at Figure 6. You can see clearly the update method is what’s taking the thread’s time.
The lines added inside the loop actually tells Cesium that if I say nothing has changed (forceUpdate is false), and the entity is set to manualUpdate, then no update is necessary for this visualizer. Note that on every update I set the forceUpdate to false. So if we do force an update, the next time the renderer comes back here, it would not update this graphic because its value would be false (unless the user changed it along the way). This way, if nothing happens, do nothing!
We do the same for billboardVisualizer.js.
In your Cesium clone, run the combine command (npm run combine) in order to generate a new Cesium build to test in your code. Take it from the Build/CesiumUnminified folder.
Now let’s run the performance recording with the new code:
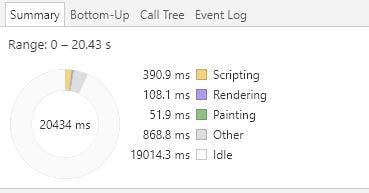
Figure 7. Summary of recording after optimization. Recording took 20.43 seconds, and idle time is more than 19 seconds.
Figure 8. The summary before the optimization.
While before optimization we had roughly 50% of the time as idle time (see Figure 8), now we have around 19/20 of the time as idle time (see Figure 7). That’s a big improvement. Let’s deep dive and compare the methods we’ve just changed:
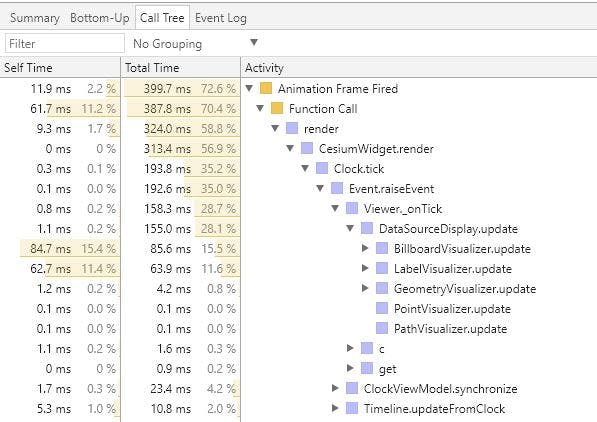
Figure 9. Deep dive after optimization. Notice that the visualizers we took care of took 85.6ms and 63.9md out of the 20 seconds of recording. Compare this to Figure 6, which showed a deep dive into functions time consumption before the optimization. Note that our updaters took roughly 4.5 and 3.2 seconds—that’s a lot of time out of 19 seconds recording.
The updaters we optimized took a very long time. In Figure 8, we see that the time for these functions dropped dramatically and freed our browser to do other work.
This implementation gives us some more power than mentioned so far. It allows us to update only a certain graphic in an entity if the others haven’t changed (for instance, if a label changed, but the billboard didn’t). Here’s an example:
// inside some loop
entity.label.text = 'New text';
entity.label.forceUpdate = true;
The code above would make sure that the label will be updated, but the other graphics would remain untouched, since they were not changed in any way.
Summary and discussion
In the first section we saw how to measure performance and pin down key points in our performance problem. We tracked the problem till we found the culprits: the billboard and label visualizers. In the second section we saw an idea of how to optimize the visualizers in order to free up scripting time and turn it into idle time. We built an API to tell Cesium when something has changed, and prevented Cesium from going over entities that did not need to change. For the computer science savvys this might seem a familiar pattern: the dirty flag design pattern.
As mentioned above, this solution is a POC only. It is for a specific use case and is not a pull request or a recommended way to change Cesium. Some more work needs to be done in order to make this a generic solution.
Some ideas how to make this change pull request worthy:
- Testing: complete testing and make sure old tests work (some of the old tests might need to be changed).
- Make sure dynamic properties change as well (for instance, just by reading the code, it seems that time dependent or callback properties would not update).
- Generalize the solution for all graphics (would probably add only a minor improvement).
- The current implementation requires the user to notify Cesium about changes. This mechanism could be inside the Cesium graphics set mechanism itself to make things more transparent for the user.
Some ideas for future work:
- Optimize the scene.render method
- Consider using WebWorker in order to render the scene and build the shaders, etc.
In conclusion, Cesium is a very versatile library with many features and performance optimizations that serve broad use cases. But for edge cases like this, there are opportunities for further optimization. What can you do to help?
- You could use the tools given here to track down optimization issues. You don’t need to fix them, just report them in the forum or GitHub.
- You can try to implement some of the ideas above or your own as a POC and publish your results in GitHub or the forum in order to get help or reviews implementing a full solution (just create your own branch, and people would be able to play with it and make their own experiments).
If you do something interesting in that field, or have an idea you’d like to share or get help implementing, reach out on the forum.