Cesium Time Animation using CZML
Using CZML to Add Time Dynamic Visualization
One of the features I like the most about Cesium is how easy it is to incorporate time dynamic visualization into your 3D geospatial projects. In this article, I will walk you through how to easily add the time dimension to your project, using an example from the live web site OregonHOWL.org.
Example: Visualizing History of Wildfires in Oregon
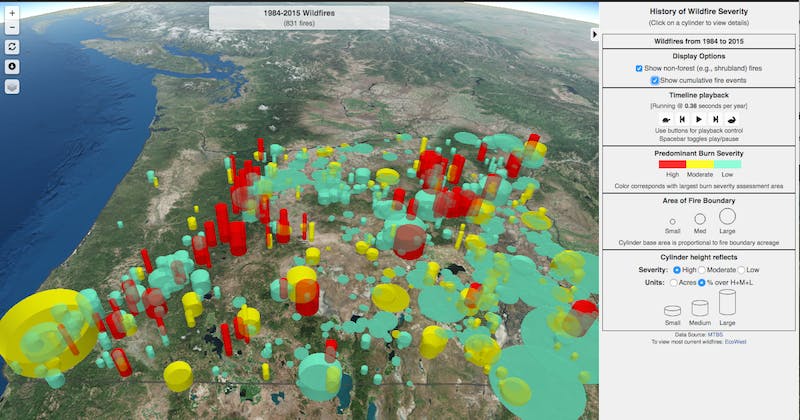
The purpose of the visualization is to break down the history of wildfires by year so that the user can have an at-a-glance view of wildfire events over the entire historical period using a time animation, as seen in the figure below.
The alternative static view of the same data depicted below may be overwhelming to the user.
You can play with the above view here.
First, Find the Time Dimension in Your Data
The data for this OregonHOWL view was obtained from the Monitoring Trends in Wildfire Severity (MTBS) website and reformatted in GeoJSON for easy consumption in a Javascript-based Web application. The source file consists of a GeoJSON FeatureCollection in which each wildfire is represented as a Point geometry like the item below.
{
  "type": "FeatureCollection",
  "features": [
    {
      "type": "Feature",
      "properties": {
        "id": "OR4200211850519840705",
        "name": "SAND HILL",
        "hydrologicUnit": "Alvord Lake",
        "acres": 12109.4,
        <b>"ignitionDate": "1984-07-05T07:00:00.000Z",</b>
        "severityUnburnedAcres": 1470.7,
        "severityLowAcres": 9762.5,
        "severityModerateAcres": 876.2,
        "severityHighAcres": 0,
        "severityIncreasedGreenesAcres": 0,
        "nonProcessingMaskAcres": 0,
        "pdfLink": "http:\/\/mtbs.gov\/MTBS_Uploads\/data\/1984\/maps\/or4200211850519840705_map.pdf",
        "kmzLink": "http:\/\/mtbs.gov\/MTBS_Uploads\/data\/1984\/kmz\/or4200211850519840705_19840707.kmz",
        "tarLink": "http:\/\/mtbs.gov\/MTBS_Uploads\/data\/1984\/fire_level_tar_files\/or4200211850519840705.tar.gz",
        "forestAcres": 0,
        "relativeArea": 0.01996
      },
      "geometry": {
        "type": "Point",
        "coordinates": [
          -118.505,
          42.002,
          1379.98
        ]
      }
    }

    ...
Notice how in our example the time dimension is the ignitionDate, highlighted above.
Second, Build a CZML Document from the Source Data
Cesium provides three abstraction layers that can be used to incorporate 3D visualizations in an application. The lowest layer is exposed in Cesium’s Primitive APIs, which offer the highest level of control over Cesium visualization capabilities, but at the expense of more low-level programming and requiring in-depth knowledge of how Cesium works. The next layer is the Entity API, which provides the ability to define high-level objects, and while requiring much less programming than the Primitive APIs, it still demands a fair amount of coding. And finally, the highest layer is CZML, which provides a data-driven interface to Cesium’s vast set of visualization capabilities.
But what exactly is CZML? Quoting the CZML Guide from Cesium, “CZML is a JSON format for describing a time-dynamic graphical scene, primarily for display in a web browser running Cesium.” A CZML document is an array of ‘packet’ elements, each of which represents one object in the Cesium visualization scene (e.g., a cylinder in our case), and its associated properties (e.g., color, position, availability). It is worth mentioning that the Cesium Sandcastle site provides a fair number of live examples that can be used to learn CZML.
There are two ways in which the time dimension can be incorporated in the objects being visualized: a) in a packet’s availability property, and/or b) in the time dimension of the packet’s position property. In our example, since the location of each individual wildfire is geographically fixed, we use the packet’s availability property. For a moving object, we would use the time dimension of the location property.
In our example, we load the data from the source JSON file using AJAX (e.g., jQuery.getJSON) and pass the result to the function makeCZMLAndStatsForListOfFires, which iterates over the GeoJSON FeatureCollection, creates a packet for each Point geometry, and returns a complete CZML data structure ready to be passed to the Cesium viewer.
function makeCZMLAndStatsForListOfFires (f) {
  // The first packet is the CZML header and the most important part is the clock definition
  var mtbsCZML = [
    {
      id: 'document',
      name: 'MTBS',
      version: "1.0",
      clock: {
        interval: '',         // This is the time range of our simulation
        currentTime: '',    // This is the time associated with the start view
        multiplier: 10518975,
        range: 'LOOP_STOP',
        step: 'SYSTEM_CLOCK_MULTIPLIER'
      }
    }
  ];

  ...

  f.features.forEach(function (feature) {

    ...

    var czmlItem = {
      id: feature.properties.id,
      name: 'Fire Name: ' + feature.properties.name,
      description:

            ...

      // Here we define the availability for each cylinder, based on the year of the wildfire
      availability: year + '-01-01T00:00:00.000Z' + '/' + year + '-12-31T23:59:59.999Z',
      cylinder: {
        topRadius: ...,
        bottomRadius:  ...,
        length: ...,
        outline: false,
        material : {
          solidColor : {
            color : {
              rgba: ...
            }
          }
        }
      },

      // Here we get the position of each cylinder from the source GeoJSON
      position: {
        cartographicDegrees: [feature.geometry.coordinates[0], feature.geometry.coordinates[1], feature.geometry.coordinates[2] + cylinderLength/2]
      }
    };

    mtbsCZML.push(czmlItem);
  });
  // Here we set the entire time interval of the simulation
  mtbsCZML[0].clock.interval = statsAll.fromYear + '-01-01T00:00:00.000Z/'+ statsAll.toYear + '-12-31T23:59:59.999Z';
  // Here we set the starting current time view of the scene, i.e., the last wildfire year reported
  mtbsCZML[0].clock.currentTime = statsAll.toYear + '-12-31T23:59:59.999Z';

  return {stats: stats, statsAll: statsAll, <b>czml: mtbsCZML</b>};
}
Cesium.CzmlDataSource.load(statsAndCZML.czml).then(function(dataSource) {
    ...
    fireListDataSource = dataSource;
    ...
    viewer.dataSources.add(fireListDataSource).then(function() {
        ...
    });
});
And Finally, Make Some Tweaks
You will definitely want to make some tweaks to your viewer, to adapt it to your required user experience. Some example tweaks include:
Customizing the Widget that Controls the Animation
While Cesium includes its own widget to control the time animations, you may want to customize a user interface for the aesthetics of your site. In the OregonHOWL.org site we replaced the default widget with a custom user interface to provide the ability to play, pause, start, end, speed up, and slow down the animation.
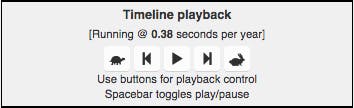
Cesium very conveniently provides two view models that can be used to control the animation: the ClockViewModel and the AnimationViewModel. With the ClockViewModel you can control start, end, and clock simulation speed. With the AnimationViewModel you can control play and pause.
First, create your ClockViewModel from the viewer’s clock:
clockViewModel = new Cesium.ClockViewModel(_viewer.clock);
Then, create you rAnimationViewModel using the ClockViewModelcreated above:
animationViewModel = new Cesium.AnimationViewModel(clockViewModel);
Finally, attach your widget click event handlers:
- Start - clockViewModel.currentTime = clockViewModel.startTime;
- End - clockViewModel.currentTime = clockViewModel.stopTime;
- Faster - clockViewModel.multiplier = factor * clockViewModel.multiplier;
- Slower - clockViewModel.multiplier = clockViewModel.multiplier / factor;
- Play - animationViewModel.playForwardViewModel.command();
- Pause - animationViewModel.pauseViewModel.command();
Customizing the Timeline Shown at the Bottom of the Viewer
While Cesium offers a default timeline, you can create a customized timeline to fit your user interface requirements. In the case of OregonHOWL.org, since we are only animating annual events in the Wildfires view, we customized the timeline labels to display only the year, instead of the full timestamp as with the default widget. We do this by overriding the viewer’s timeline make Label function:
_viewer.timeline.makeLabel = function(date) {
    var gregorianDate = Cesium.JulianDate.toGregorianDate(date);
    return gregorianDate.year;
};
Please note that makeLabel is a private function of Timeline and as such is not in the official documentation. If the Cesium developers decide to change this function in the future, this functionality could be affected.
Updating User Interface Elements as the Simulation Executes
As you can see in our application, the label on top of the viewer dynamically displays the year and the number of fires being displayed as the years go by.
To achieve this, simply attach an event listener to the viewer’s clock, and in the callback execute the logic necessary to update the user interface elements.
_viewer.clock.onTick.addEventListener(function(event) {
    // If the year changed, update label information
});
Be sure to check for the granularity of the time events so that you update user interface elements only when necessary. This is important, because updating the DOM is very expensive and you do not want to perform DOM operations if nothing actually changed. In our case, we only change the information on the label as the year changes.
The code for the complete project is open source and is available on Github. The code most relevant to this article can be found in the wildfire view under the src directory.
In the OregonHOWL.org there is a different view (The Journey of Wolf OR-7), which implements the time simulation using a combination of the time dimension in the objects’ position and the packets’ availability property. The code for that view is here.
I hope this article helps you painlessly incorporate the time dimension in your Cesium applications.