Historic Pharsalia Cabin Point Cloud Using Cesium & 3D Tiles
Our friends at Trimble created an amazing 6.4 billion point model of the historic Pharsalia cabins in Virginia. This was collected in one day with 72 scan locations both outside and inside the cabins using a Trimble TX8 scanner, which can acquire up to one million points per second. The result has sub-centimeter accuracy!
Using the upcoming 3D tiling pipeline in cesium.com, we tiled this point cloud—in 72 minutes on a single machine—to 3D Tiles for streaming to Cesium. (EDIT: this was optimized since the initial blog post when it tiled in 90 minutes) We’d like to share a few of our favorite finds in this point cloud.
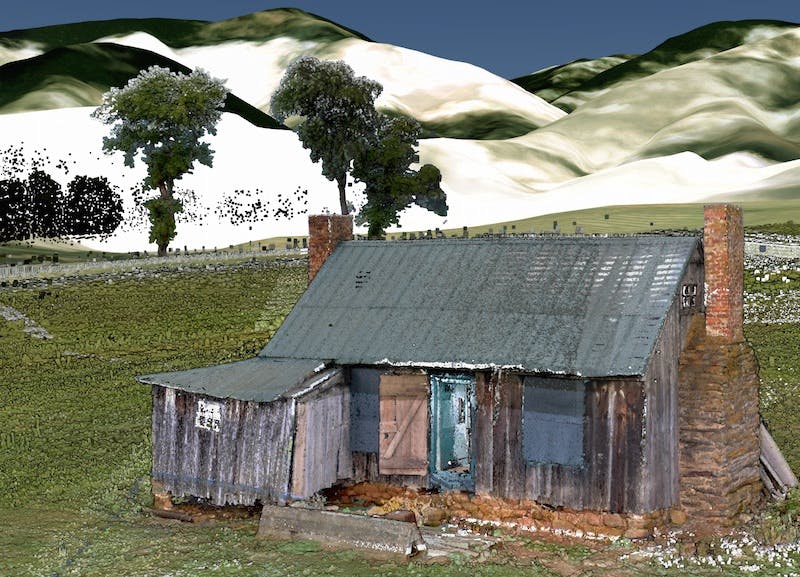
LiDAR profile of the Pharsalia site in Virginia. Image credits: Trimble, Inc.
Above, the main cabin is shown with point size attenuation and eye-dome lighting to help highlight the surfaces. Note the data fusion with Cesium terrain and Bing imagery in the distance.
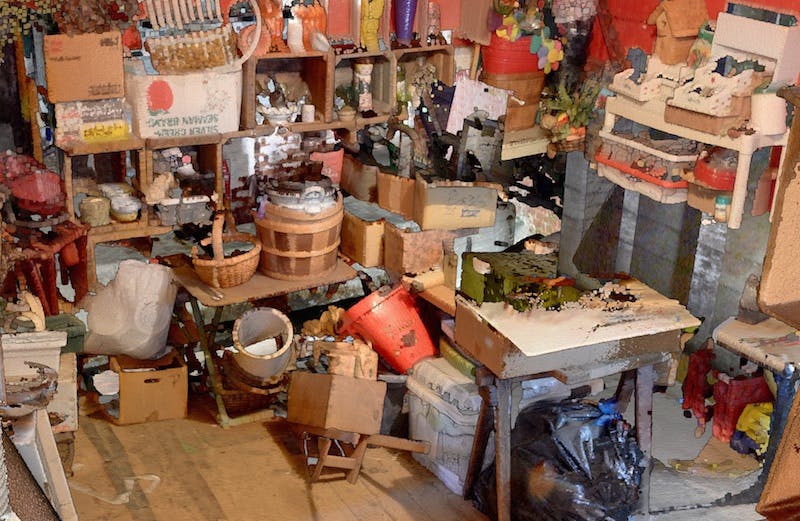
Below, we zoomed into the attic of one of the cabins. Check out the incredible detail on the baskets and other items!
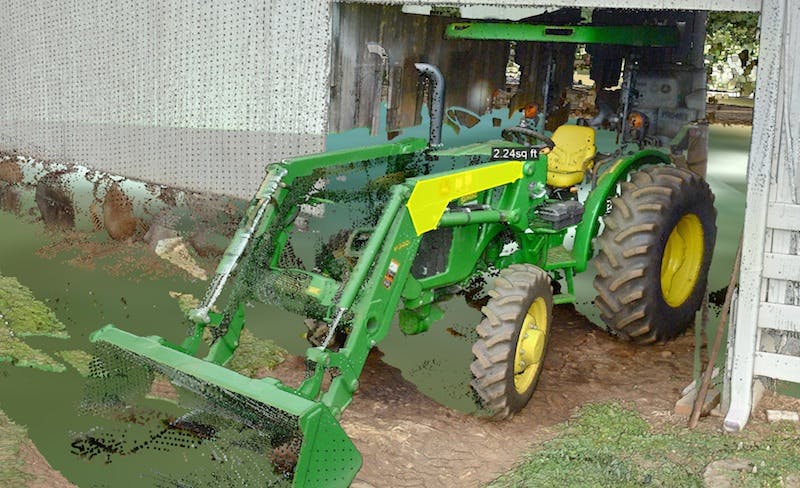
In addition to 3D tiling, cesium.com includes a set of measurement tools for determining area, length, angles, and height for point clouds and anything that Cesium can render. The area tool is shown here on a tractor, one of several vehicles captured in the point cloud.
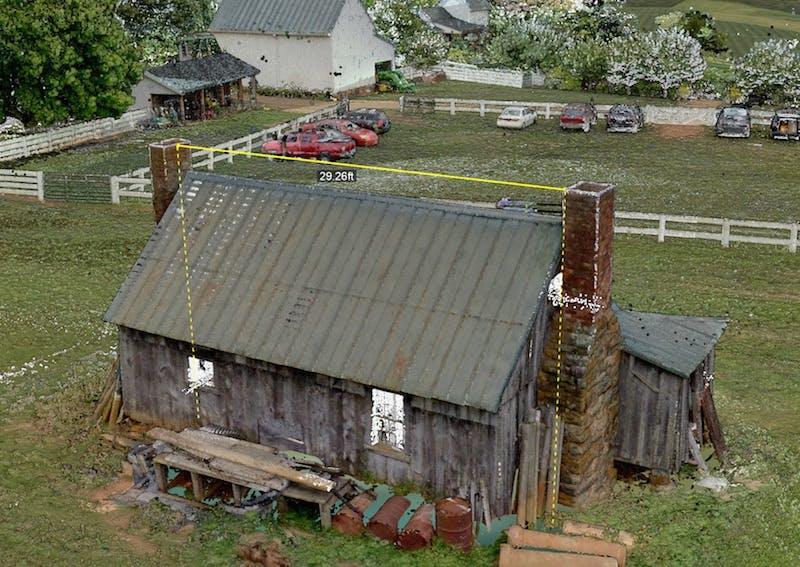
Here’s a locked height and angle measurement showing the chimney-to-chimney distance. Yes, that is the same tractor in the distance.
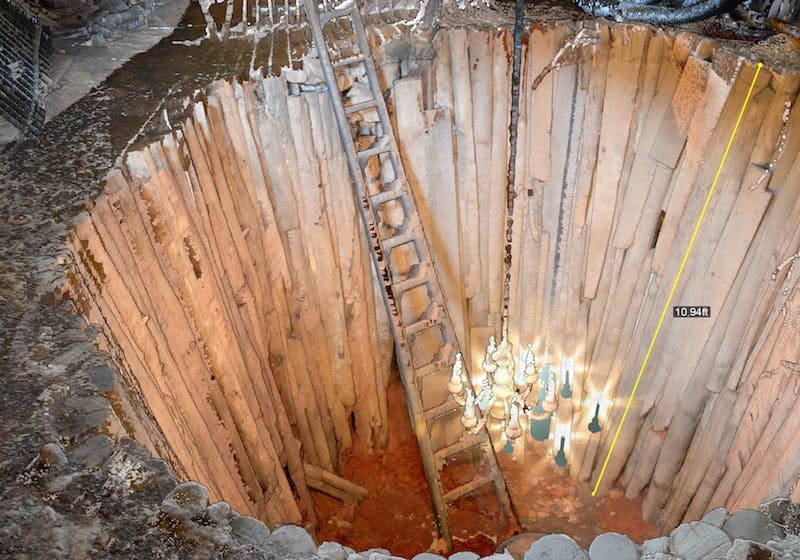
A pit in the basement of the ice house was used to store ice to make ice cream and iced tea. Here it is with height measurement.
For interior measurements, it is useful to use the tools in conjunction with horizontal and vertical clipping planes. Below, clipping planes expose the cabin’s attic and first floor. We used a distance measurement to determine the lengths and angles of a right triangle.

Note that the insides of the walls and the ceiling/floor are implicitly “captured”—these could be used for measurements but a scanner was not placed inside to capture the actual contents.
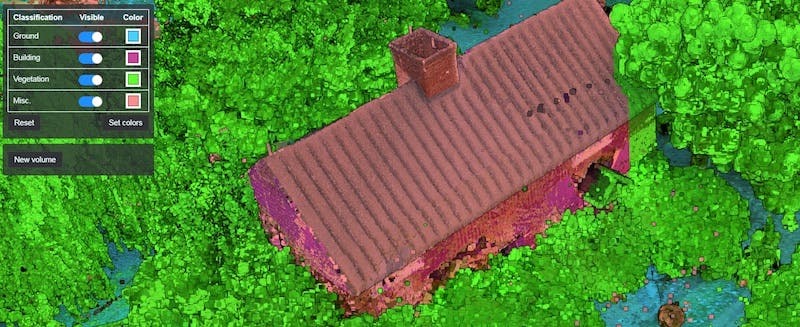
The point cloud was classified with Trimble’s software. The per-point metadata was preserved during tiling and then used for distinctly shading the structures, vegetation, and ground.
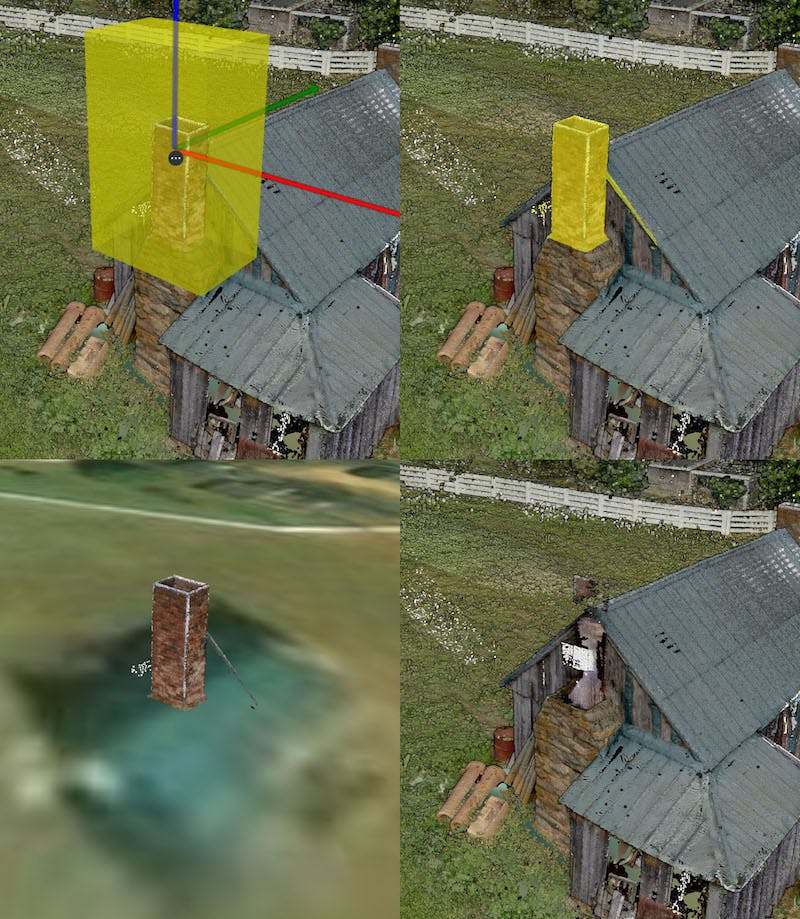
With the cesium.com tools you can also draw volumes to highlight, isolate, or hide parts of the point cloud as shown below.
Here is a video showing this great point cloud in more detail:
If you are working with LIDAR and massive point clouds, feel free to say hi, or visit my colleague, Todd Smith, at the International LiDAR Mapping Forum this week.
For more on Trimble’s 3D scanning, check out their solutions.