Explore Precipitation Data On and Above the Globe with NASA STORM Virtual Globe
Hundreds of kilometers above Earth, precipitation satellites fly by, observing clouds and rainfall using passive and active sensors. Some of them measure the temperature of the atmosphere and surface, from which information can be gleaned about how much rain and snow are falling at that moment. Others bounce microwaves off the clouds, assessing what size water droplets and snowflakes are falling based on how those microwaves come back.
Global Precipitation Mission (GPM) satellite data is crucial to weather decision making and historical precipitation climatological analysis. GPM is a collaborative effort between the United States’ National Aeronautic and Space Administration (NASA) and the Japan Aerospace Exploration Agency (JAXA). It has two primary instruments: the Dual-frequency Precipitation Radar (DPR) and GPM Microwave Imager (GMI). DPR provides 3D scans of snow and liquid water above the Earth’s surface. GMI observes the brightness temperature of microwave radiation coming from Earth at numerous different frequencies. Both instruments combine to provide a thorough assessment of precipitation rates and types as the satellite orbits Earth once every 90 minutes between 65 N and 65 S latitude. GPM data are made available at the NASA STORM website anywhere from 24 to 36 hours after the original satellite flyover, while near real-time (NRT) data is output within 30 minutes for GPM microwave imagery (GMI) and 2 hours for dual-frequency precipitation radar (DPR).
Matt Lammers, web analyst/developer for the NASA Precipitation Processing System (PPS), has developed a number of systems to visualize this data in 3D using Cesium.
STORM Virtual Globe
The STORM Virtual Globe allows users to explore global precipitation in 3D. The data is read directly from the raw HDF5 files, converted into JSON, and visualized in Cesium without storing any post-processed files. This is enabled by the STORM website being built on top of the Java Tomcat service, which allows the creation of servlets written in compiled Java to be exposed online. STORM VG performs Ajax queries to grab the satellite data from the servlet.
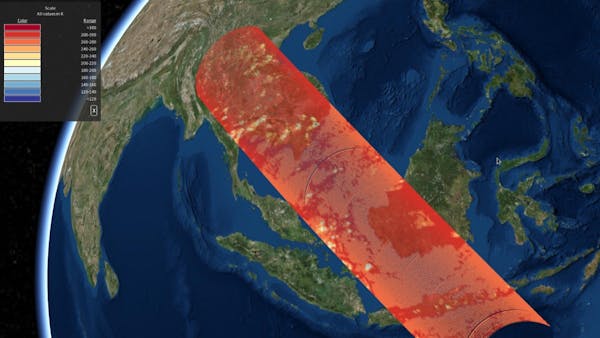
Depending on the file being explored, STORM VG presents the user with two different ways of exploring the precipitation rate information. Level 3 precipitation data (meaning it is stored in a non-orbit-based way) simply displays the entire grid at once. Each grid point can be moused over for the raw integer precipitation rate value. Level 3 GPROF files feature 0.25 degree gridded precipitation rate data from a single satellite aggregated over an entire day. Level 3 IMERG files combine information from a number of satellites with surface observations on a half-hour basis. Level 2 data (stored in an orbit-based way), being often higher resolution, is made available fifteen minutes at a time. Using a scroll element, the user can look at any portion of the orbit, with both camera motion and a polygon making apparent where the new segment will appear.
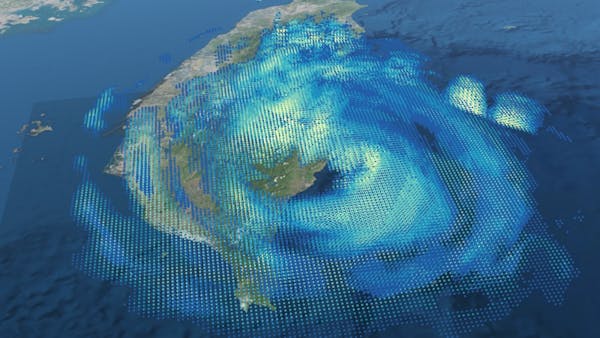
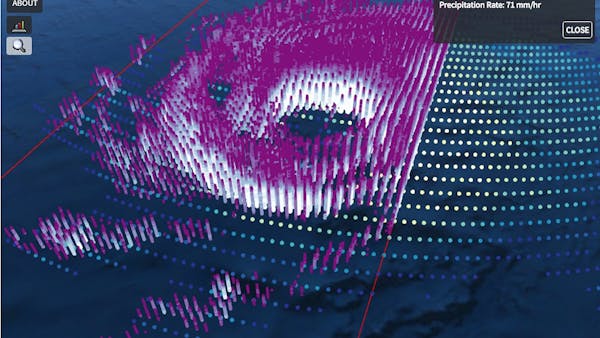
Radar products (2ADPR and 2BCMB) provide information both in the horizontal and the vertical about precipitation rate, and so data points are visualized both on the surface and through the lower atmosphere, giving information about the overall structure of storms. To see what’s possible with the Storm Virtual Globe, check out this perfect flyover by the GPM core satellite of the eye of Super Typhoon Vongfong in October 2014.
STORM Event Viewer
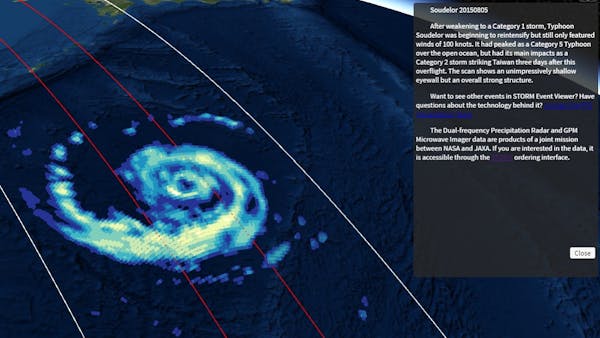
For outreach purposes, PPS highlights specific high-impact events in the STORM Event Viewer. The tool is updated frequently when GPM flies over new major events such as tropical cyclones and outbreaks of tornadoes.
STORM Event Viewer generates simple JSON files server-side on the fly from HDF5 binary files. These JSON files provide latitude, longitude, elevation, and precipitation rate values from which CesiumJS can then generate pointPrimitive objects. Because some of these events garner a lot of attention, JSON files are sometimes generated and stored ahead of time to minimize server impact and prevent latency.
To broaden the appeal of STORM Event Viewer, PPS adapted the interface to make it more friendly for mobile/tablet users and to enable its embedding in NASA news releases and articles. EVMini is stripped down for smaller screens, although it maintains the ability for users to view individual data point values and to read brief summaries of the events for context. It runs smoothly despite all of the points being displayed because CesiumJS is so mobile-friendly. EVMicro is designed to be embedded, so it removes all of the controls, preserving a simple interactive visualization that highlights the satellite data and the ability to delineate between frozen and liquid precipitation in the DPR scan.
Global Precipitation Mission (GPM) Near Real-Time (NRT) Viewer
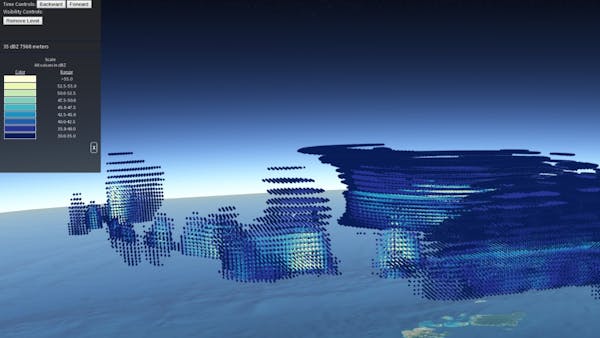
GPMNRTView visualizes NRT data collected by GPM. The pipeline efficiently processes the GPM NRT HDF5 files into CZML and makes those files available for visualization for a rolling 12-hour period. Swath-based file sizes are kept small by tracking a cross-track set of pixels as they change through time rather than storing positions and visibility information for every pixel in the segment. This allows for further condensing of space by only tracking changes in color rather than storing each value for each instrument scan. Users must step through time to make data appear, but this can be sped up using the Cesium time widget controls.
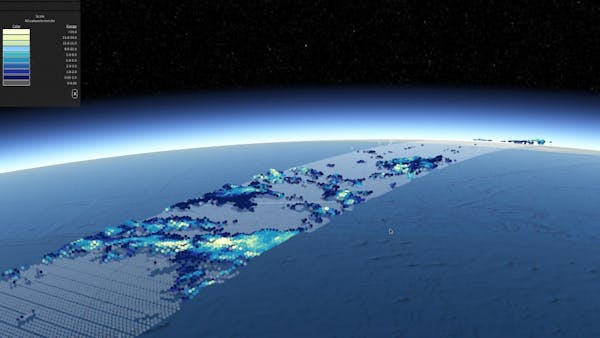
Four products are available in GPMNRTView. Level 2A DPR is a narrow swath-based product that plots data points at storm top height, rather than on the surface, to provide a 3D representation of precipitation. Level 1C GMI is a wider swath-based product showing various brightness temperatures at various frequencies. Depending on the frequency, different atmospheric properties can be teased from the information, including wind speed and precipitation intensity. Level 2A GPROF takes the Level 1C GMI data and algorithmically converts it into precipitation information, such as probability of precipitation and precipitation rate.
The final product, Level 3 IMERG-Half Hour, takes information from several precipitation satellites along with model data and surface observations and generates precipitation rate information for a 0.1 × 0.1 degree latitude/longitude grid for a given half hour period with a latency of approximately 3 hours. With this data, not only is the entire globe shown at once (rather than information appearing for a swath as it animates), but also the data points can be moused-over to see the raw values.
STORM Virtual Globe HWRF
While STORM Virtual Globe and GPM NRT show satellite data, STORM Virtual Globe HWRF (STORM VG HWRF) shows forecast data for Super Typhoon Nepartak, which struck the southeastern coast of Taiwan on July 7, 2016 with maximum sustained winds of 150 mph and a central pressure around 930 mb. 16 hours prior to landfall, the National Weather Service’s (NWS) Hurricane Weather Research and Forecasting (HWRF) model output projected radar reflectivities for the storm, anticipating the rainfall intensities that would be associated with Nepartak’s arrival. This output was stored in GRIB2 format (a World Meteorological Organization standard gridded binary format) and made available at the National Oceanic and Atmospheric Administration (NOAA) Operational Model Archive Distribution System (NOMADS) website.
It is important to recognize the interplay between observed values and computer model forecasts. Cesium has the ability to enhance the ways in which gridded atmospheric model output can be presented and investigated online. Despite advancements in high-resolution modeling of extreme weather events, it remains common to look at the model output with static 2D imagery. STORM VG HWRF shows that not only can 3D interactive visualization easily be done with this sort of data, but that it can be done online and shared among the entire scientific community.