JS.Geo Trip Report
On October 8 we attended JS.Geo. The conference brought together a community of those interested in visualization, analysis, and cartography using JavaScript technologies at the University City Science Center in Philadelphia. This day-long event spotlighted presentations by 26 speakers in total, both scheduled and improvisational. This was our first time attending a conference and our first exposure to the geospatial community. Here are the highlights of the day.
Photo by @disruptivegeo
Chris Whong (CartoDB) - NYC Taxis: A Day in the Life
@chris_whong
Chris presented his viral data visualization of the routes and earnings of a single random NYC taxi throughout a day. Through New York State's Freedom of Information Law, he obtained trip data from 2013 and dump it online. With help from Google BigQuery and the Reddit community, he developed a SQLite query to grab his target data: geographic start and end points of each trip taken by a taxi over 24 hours. He then smoothly animated the points on a map using the SVG stroke-dasharray attribute. Other technologies involved in the project include Google Directions API, Node.js, Leaflet, and D3.js.
Anand Thakker (Development Seed) - Data Analysis with Vector Tiles
@anandthakker
Anand focused on vector tiles and how they can be used for “scale independent interactive analysis” and visualization. Tiles are good for parallel processing because of how they are broken up and because they are simple, fast, and interactive. Raw data can be transformed into vector tiles from which GeoJSON can be extracted for analysis using libraries such as Turf.js.
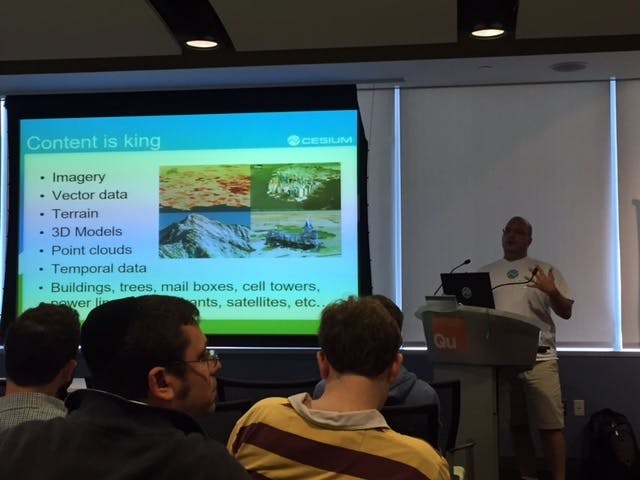
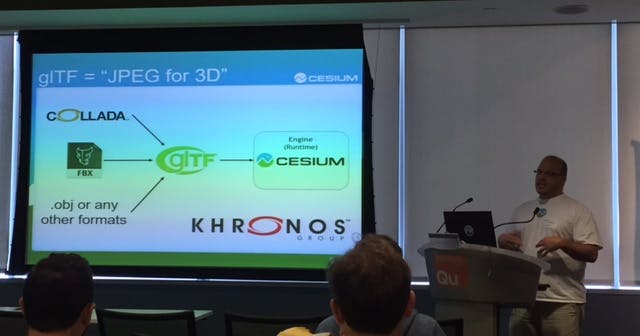
Matt Amato (Cesium) - Future of 3D Geospatial Standards
@matt_amato
Matt Amato of AGI and cofounder of Cesium demoed 3D Tiles in New York using OpenStreetMap data and described the open standards Cesium has played a part in. Cesium created open specification quantized-mesh for terrain and has played a big part in developing GL Transmission Format (glTF), a standard format for web-friendly runtime 3D models. Patrick Cozzi, another cofounder of Cesium, and several Khronos members are spearheading the efforts for glTF, which has been adopted in projects including popular WebGL library three.js, Microsoft's Bablyon.js, and LibreOffice. Cesium is also working on interactive and styleable 3D Tiles, an open spec for streaming massive 3D spatial datasets built on existing standards. Check out the demo and the slides from the expanded talk.
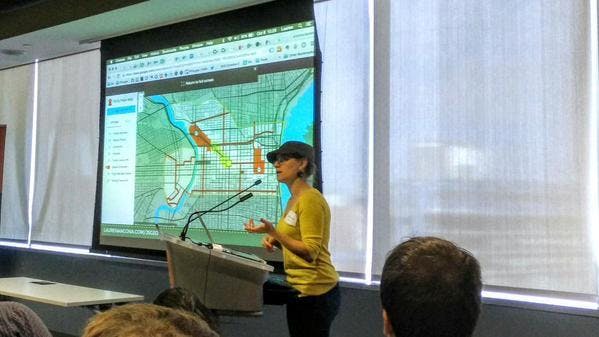
Photo by @vtcraghead
Lauren Ancona (City of Philadelphia) - #PopeInPhilly
@laurenancona
Lauren highlighted the failure of maps that were released for the Pope’s visit to Philly. Although the maps were intended to inform visitors about information such as street closures and high security areas, distributed data was disorganized, untimely, and in unhelpful formats such as PDFs. Data was constantly changing and maps needed to adjust. She built an interactive Pope map with a high contrast color scheme for visibility on mobile to help the projected one million visitors to the city easily view information necessary for the Pope’s visit.
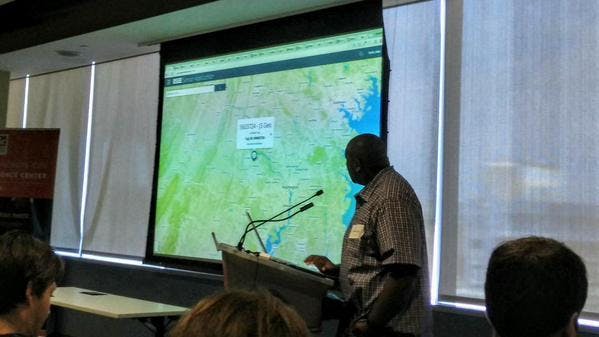
Photo by @vtcraghead
Alex Bostic (AECOM) - Real Time GIS
@habostic
Alex talked about building the MEAN stack into a satellite data pipeline for a prototype sensor application that uses grid satellite tags for data with the goal of achieving real-time GIS. Among other things, the application transforms the binary satellite data into hex, which is then parsed using the node-bitarray library, to decrease expensive message costs.
Norman Barker (IBM MobileFirst Presence Insights) - Indoor Location
@normanbarker
Norman focused on indoor micro location tracking. Wi-Fi and Bluetooth detection can be used to monitor metrics, track customers traversing a store, engage with customers through dynamic product placement, and gather data on traffic trends. He noted the differences between four types of location data (macro, micro, physical, enterprise) and the difficulties in calculating accurate indoor position.
Stuart Lynn (CartoDB) - Torque: Beyond Points
@Stuart_Lynn
Stuart showcased the newly open-sourced library Torque for time dynamic data and visualizations. A surprising number of maps on the web are static even though the “world is space plus time.” Stuart covered data compression problems with online maps and how Torque addresses them by taking all the data points, throwing them into “bins,” and then placing them on a map.
Andrew Turner (Esri) - Esri R&D JS (Some Projects)
@ajturner
Andrew shared demos of eight R&D projects featuring the ArcGIS Rest API: koop, geocommons, segment, malette, version, mundi, and cedar. He touched on styling for APIs and the idea that sometimes you might not need a map to visualize geographic data.
Bryan McBride (Fulcrum) - Custom Data Collection Workflows with JS Field Calculations
@brymcbride
Bryan demoed Fulcrum’s multi-platform app for offline data collection in the field. The applications included researchers studying de-mining effort in Cambodia, sea turtle data, and water quality. All the data collection must be done offline, so they were able to produce the app by “stuffing JavaScript into mobile.” Bryan showed his “hack” where he included entire JavaScript libraries in a single string.
Ishmael Smyrnow (AppGeo) - Data Processing with Node.js
@ISmyrnow
Why use Node.js? Ishmael explained the benefits of using Node, including its great package manager, NPM, that boasts tons of modules. He also provided a slew of tips for using Node, such as making sure to take advantage of existing modules and providing useful module suggestions.
Michael Bowman (Applied Information Systems) - Squatchin with D3.js
@webslingerm
Michael demonstrated a workflow for transforming data into a map. He selected a dataset detailing Bigfoot sightings in North America and went through all the steps necessary to turn that data into a full-fledged map, including how to find data, how to use D3.js to construct the map and select the projection, how to use PhantomJS to simulate a browser in Node, and how to pull out the SVG file to further modify in Adobe Illustrator or other post processing applications. Check out the app here.
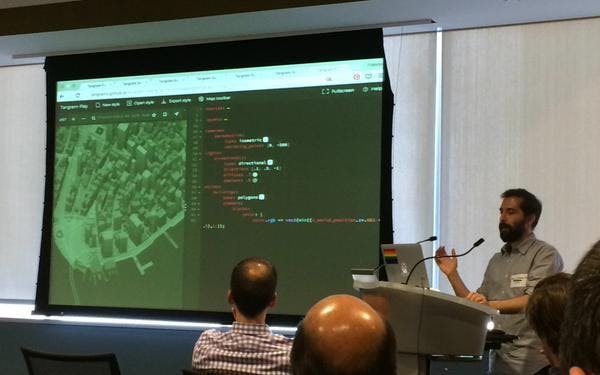
Photo by @disruptivegeo
Patricio Gonzales-Vivo (MapZen) - Tangram: Website Maps for Vector Data
@patriciogv
Patricio demoed Tangram, MapZen's application for 2D and 3D real time map rendering. He highlighted the lighting system he designed and a sandbox for applying styles and shaders to the maps where the application of components such as shaders can be designed visually through pop-up boxes shown right in the code. Check out the talk here.
Aaron Petcoff (NY Magazine) - Property in Practice (Visualizing Detroit’s Housing Crisis)
@ughitsaaron
In his talk, Aaron sought to “illustrate how speculation shapes the physical and geographical space of Detroit” with maps. He described the background of and factors contributing to the housing crisis in Detroit and showed an application he built to visualize it. Some of the technologies involved in the process include Sheetsee.js, Tabletop, Mapbox, GitHub, and Sass. The emphasis of the talk was the power of visualization and how we can use data for social justice.
Tom MacWright (Mapbox) - How We Got Here
@tmcw
Tom explored map rendering technique improvements leading to vector tiles. He explored WMS, Google style tiles, and tiles with overlays like Leaflet, and finally brought it back to vector tiles. He suggested that the most important technique to improving map performance was, to borrow a term from computer graphics, “culling,” or as he defined it "choosing what not to draw."
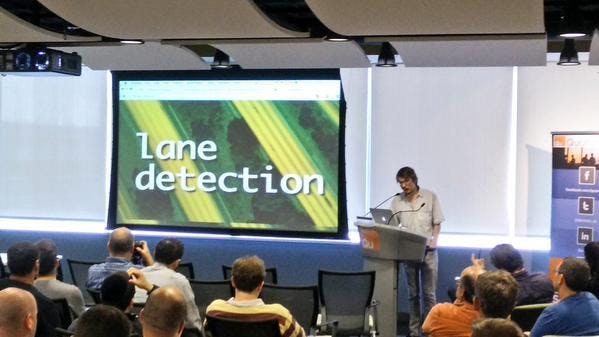
Photo by @vtcraghead
Morgan Herlocker (Mapbox) - Geospatial Machine Learning
@morganherlocker
Morgan tackled the hot topic of machine learning and in particular how it can be applied to the geospatial world. He explained that machine learning is simple: it’s just statistics. He described how neural networks work by mimicking human learning. This can be applied to a myriad of applications, such as lane detection mapping automation and code base vandalism prevention. Suggested libraries useful for machine learning include Brain, Nodefan, ConvNetJS, Natural, and SentimentJS.
There were additionally six planned and five improvisational lightning talks highlighting other cool things happening in geo.
Drew Bollinger of Development Seed shared some tips on how to use HTML5 canvas with images and raster tiles. Check out the app here.
Dana Bauer of Planet Labs exhibited some of the high resolution images Planet Labs is taking with their satellites and challenged us with the question: how can we make a difference with the data we collect?
Christopher Pollard, a GIS specialist demoed Open Freight App, an open source data and mapping template for freight, and also mentioned the PhillyFreightFinder and CyclePhilly apps.
Calvin Metcalf from AppGeo spoke about writing a WMS/WMTS server and complained that WMS is slow and not good for many reasons.
Diana Shkolnikov from MapZen presented an entertaining Mapzen Geocoder infomercial featuring audience participation.
Jill Hubley, an independent developer, showed us Invasive Ricochet, a cool installation app where you touch plants to trigger JavaScript events that show the impact of invasive species in the Bay Area on a connected screen.
The day ended with quick improvisational talks by Bill of Faraday, Tom from the City of Philadelphia, Daniel from Esri, Ian from OpenAddresses, and Ryan, a PhD student and side developer.
MC Brian (@briantimoney) did a commendable job keeping the flow of the conference and stringing together the 26 equally as great speakers, all in one day. Thanks to organizers Brian Timoney and Chris Helm and to sponsors Azavea, Bright Rain Solutions, CartoDB, Cesium, Fulcrum, IBM MobileFirst, Mapzen, and ZekiahTech, JS.Geo was an amazing day filled with techniques and applications being explored in JavaScript and the geospatial world.